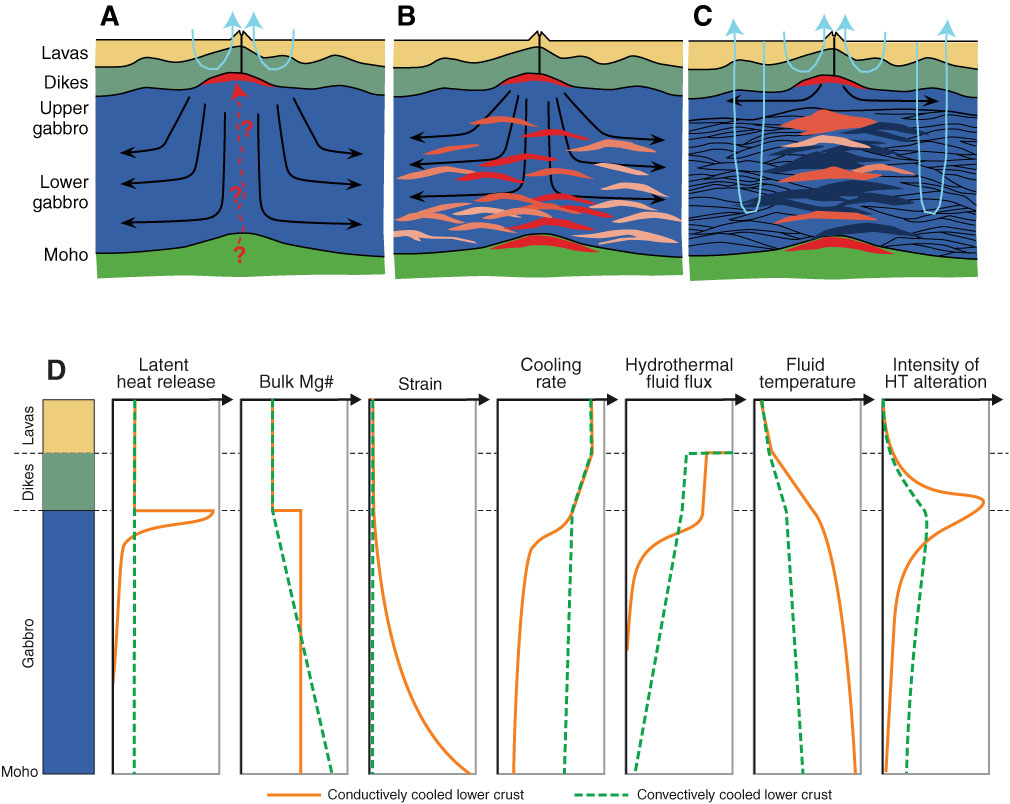
Figure F4. Schematic drawings of crustal accretion models (modified from Korenaga and Kelemen, 1997). Black arrows show the movement of the solid lower crust; blue arrows show the dominant zones where hydrothermal circulation will remove latent and sensible heat; red arrows show the movement of magma—this is unknown in all models. A. Gabbro glacier ductile flow model (e.g., Henstock et al., 1993; Phipps Morgan and Chen, 1993; Quick and Denlinger, 1993). Ductile flow down and outward from a high-level axial magma chamber constructs the lower crust. B. Hybrid model of ductile flow with sill intrusions (e.g., Boudier et al., 1996). C. “Sheeted” or “stacked” sill model of in situ formation of the lower crust by on-axis sill intrusions (e.g., Bédard et al., 1988; Kelemen and Aharonov, 1998; Kelemen et al., 1997; MacLeod and Yoauancq, 2000). D. Schematic relative variations in the general trends of latent heat release, bulk Mg#, strain rate, cooling rate, hydrothermal fluid flux, fluid temperature, and intensity of high-temperature (HT) alteration with depth predicted by end-member “gabbro glacier” (with mainly conductive cooling of the lower crust) and “sheeted sill” (with convective cooling of the lower crust) models of crustal accretion (original figure by R. Coggon).
Previous | Close | Next | Top of page