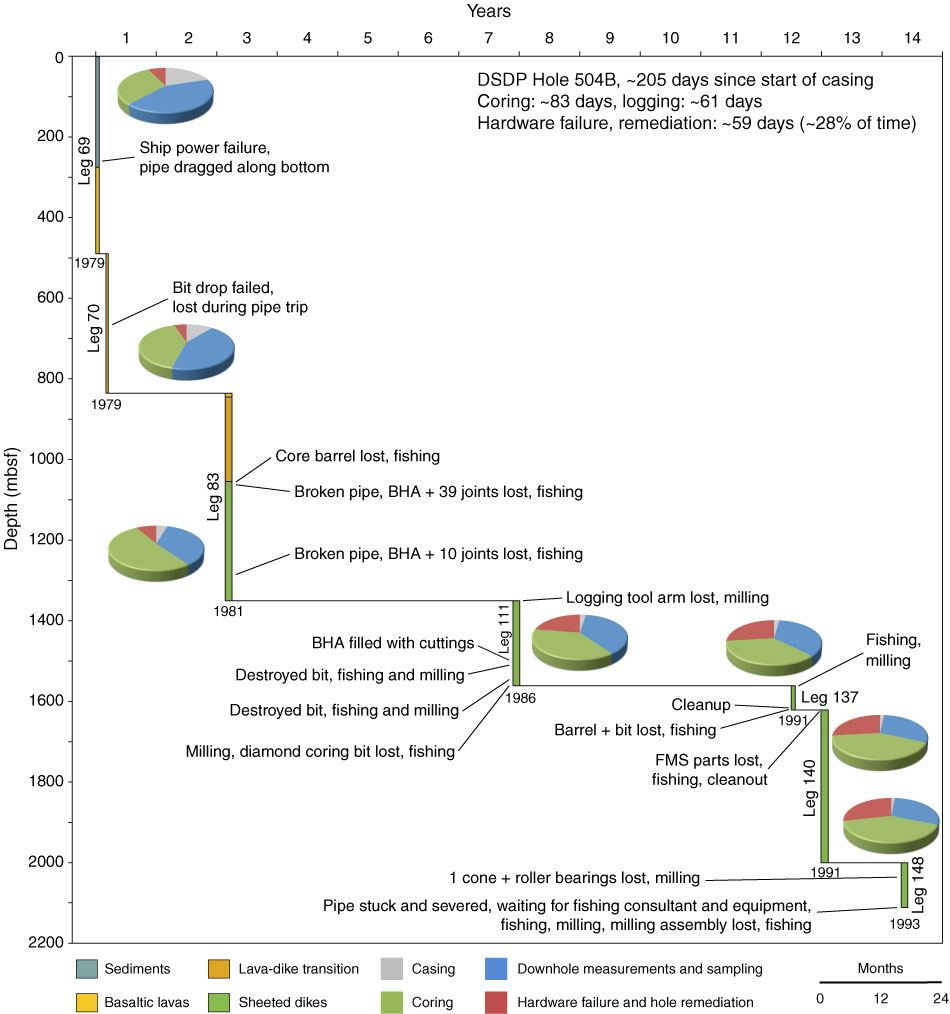
Figure F8. Time vs. depth plot for Hole 504B. Width of colored bars is proportional to the duration of DSDP and ODP legs. Major hardware failure and remediation events are reported at the depth to which they occurred. Pie charts indicate, at the end of each cruise, cumulative proportions of time spent in casing, logging, coring, and tool breaking/hole remediation since the start of operations in Hole 504B. BHA = bottom-hole assembly, FMS = Formation MicroScanner.
Previous | Close | Next | Top of page