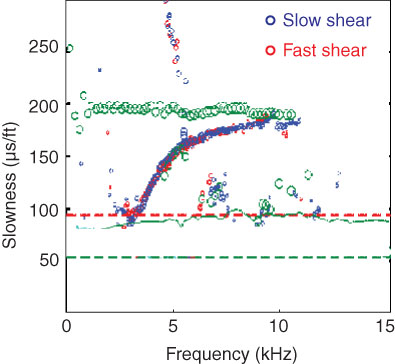
Figure F7. Example of flexural wave dispersion plot at 480 mbsf, Hole 1256D. Green and red dashed lines indicate compressional wave and shear-wave slownesses, respectively. Dispersion curves for dipole flexural wave computed are from rotated slow and fast shear wave fields. Green circles correspond to Stoneley wave slowness, which provides an upper limit for flexural wave slowness (Ellis and Singer, 2007). Overlapping fast and slow dispersion curves are indicative of isotropic formation.
Previous | Close | Top of page