Previous | Close
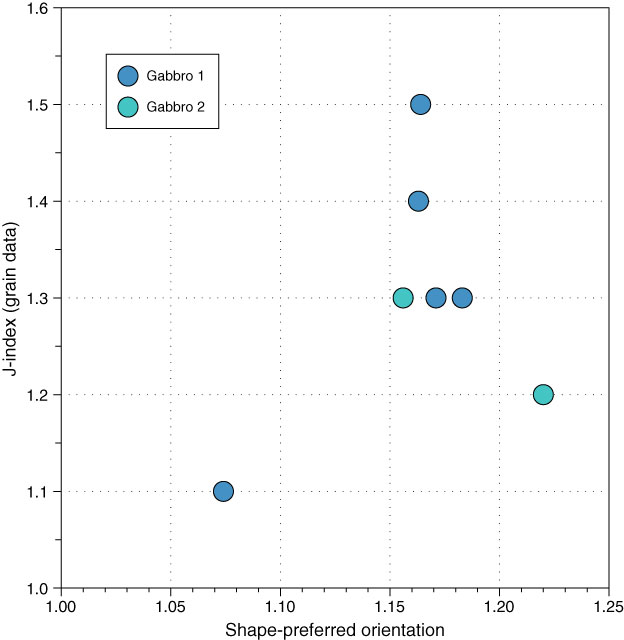
Figure F8. Plot of J-index (grain data) for plagioclase as a function of shape-preferred orientation (axial ratio of the fabric ellipse) in thin sections. See text for further explanation.
Previous | Close | Top of page