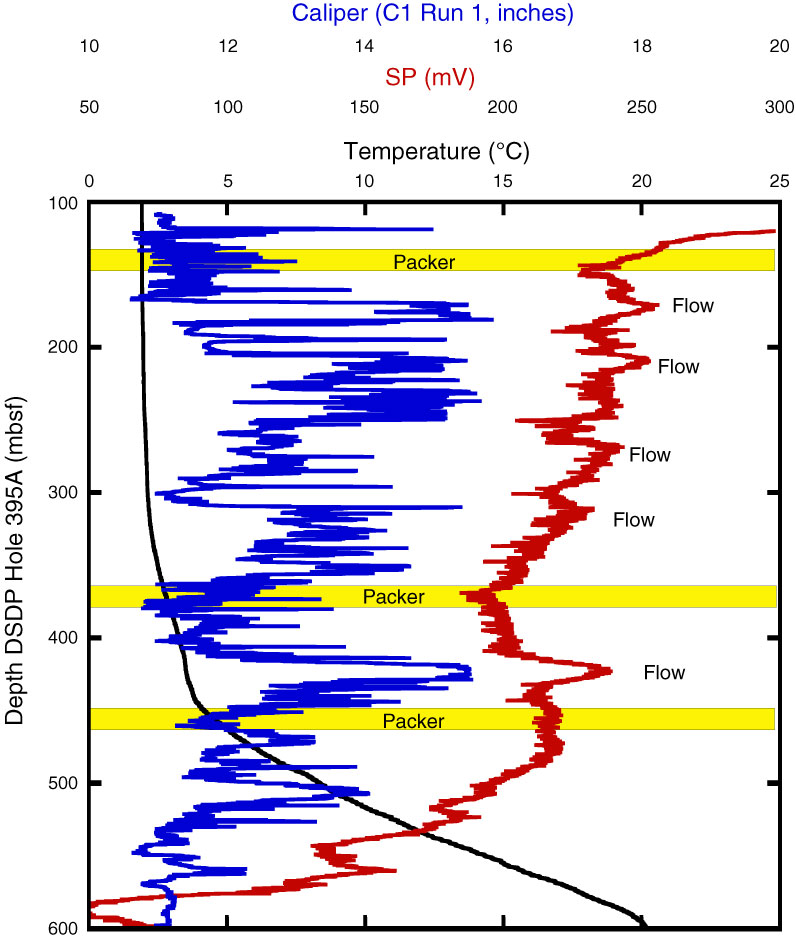
Figure F11. Plots of caliper, spontaneous potential (SP), and temperature logs from Hole 395A collected during ODP Leg 174A. Yellow bars = locations of CORK packers intended to isolate different hydrologic zones to monitor and sample.
Previous | Close | Next | Top of page