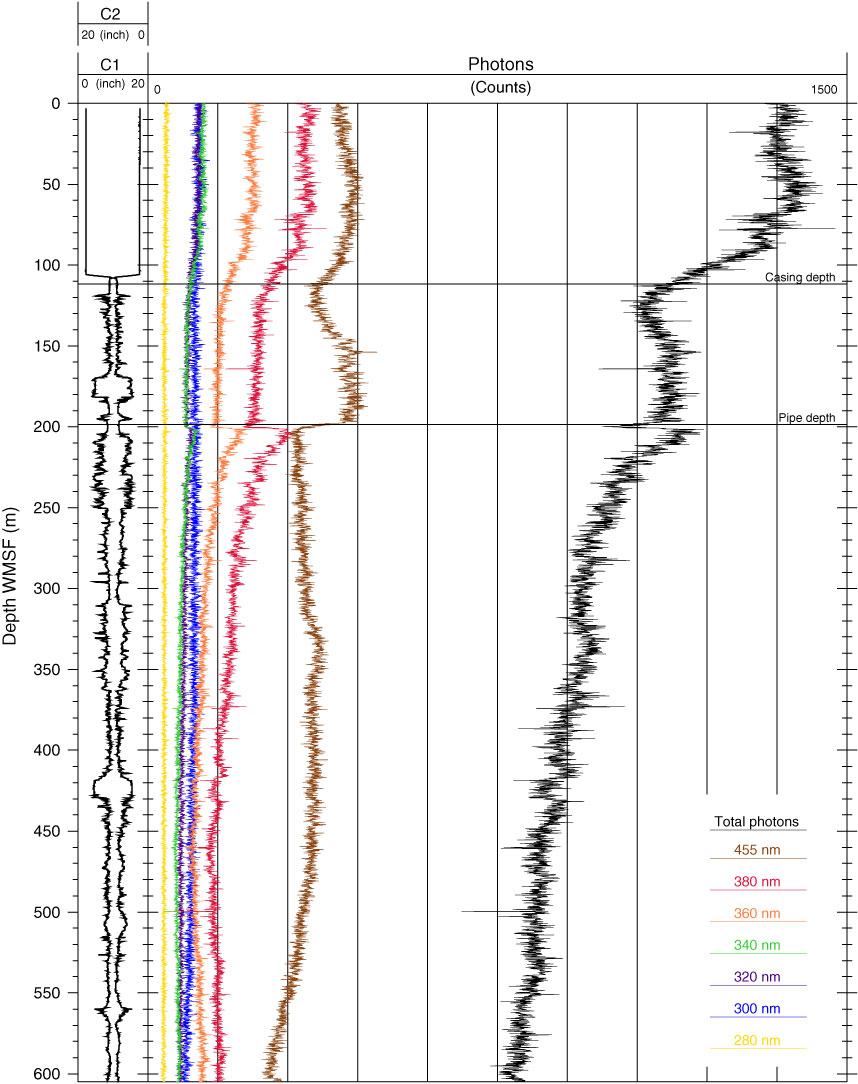
Figure F18. Photon intensity plots from Hole 395A (Run 2, downlog Pass 1). Photon counts indicate high concentrations of organics in the borehole fluids. The 320 and 340 nm bands, which are used for assessment of microbial bioload, are uniform throughout the borehole. The 360, 380, and 455 nm bands change as a function of depth and correlate with the temperature gradient in Hole 395A. These bands are representative of higher weight molecular organics.
Previous | Close | Top of page