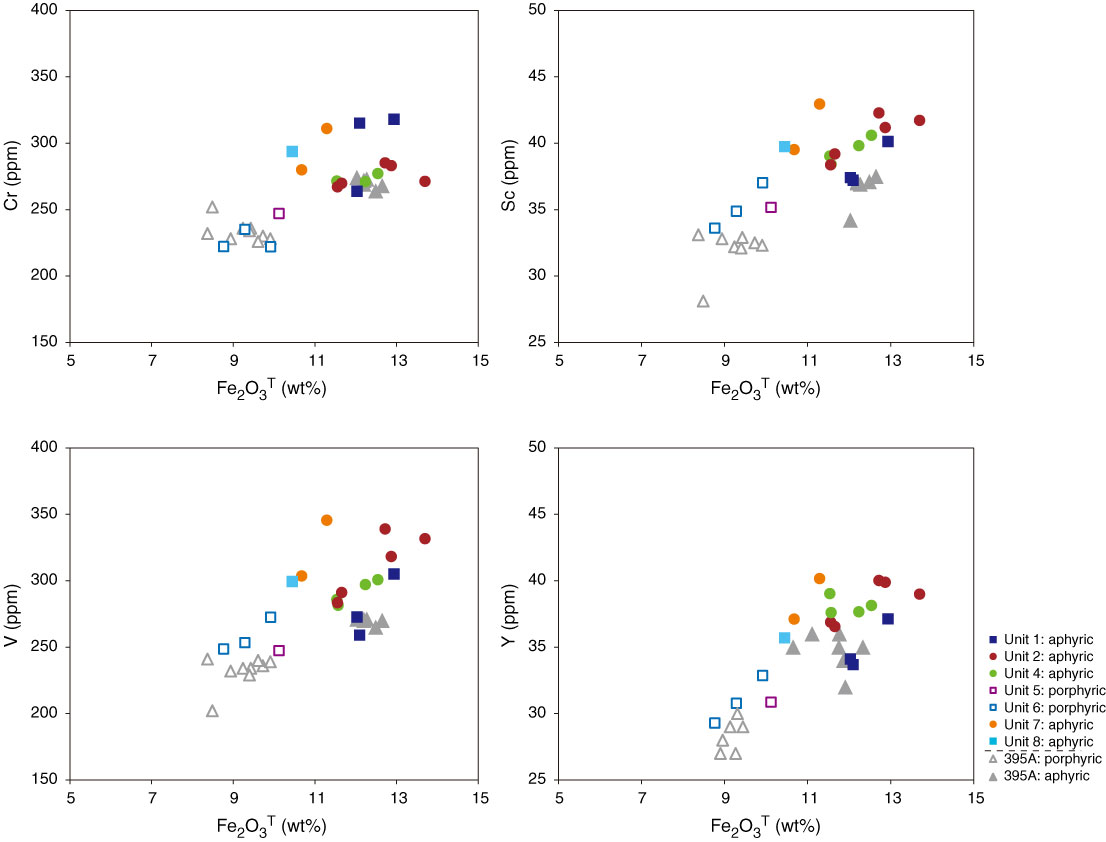
Figure F25. Plots of Fe2O3T vs. Cr, Sc, V, and Y for basaltic rock samples, Hole U1382A. Data for aphyric and porphyritic basalts from corresponding depths in Hole 395A (Rhodes et al., 1979; Bougault et al., 1979) are also shown for comparison. Fe2O3T = total iron as Fe2O3.
Previous | Close | Next | Top of page