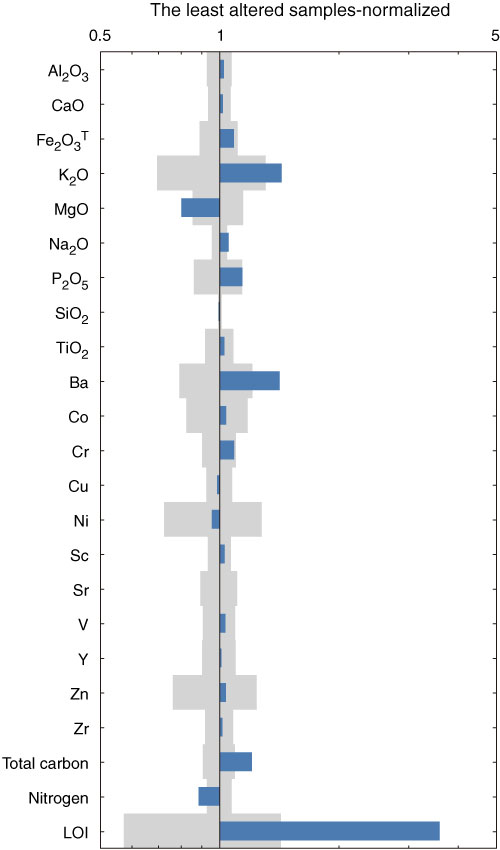
Figure F27. Bar chart showing average compositions of altered samples normalized by those of the least altered samples, Hole U1382A. Values < 1 indicate depletion and vice versa. Gray areas represent the compositional range (±1σ) of the least altered samples. Fe2O3T = total iron as Fe2O3. LOI = loss on ignition.
Previous | Close | Next | Top of page