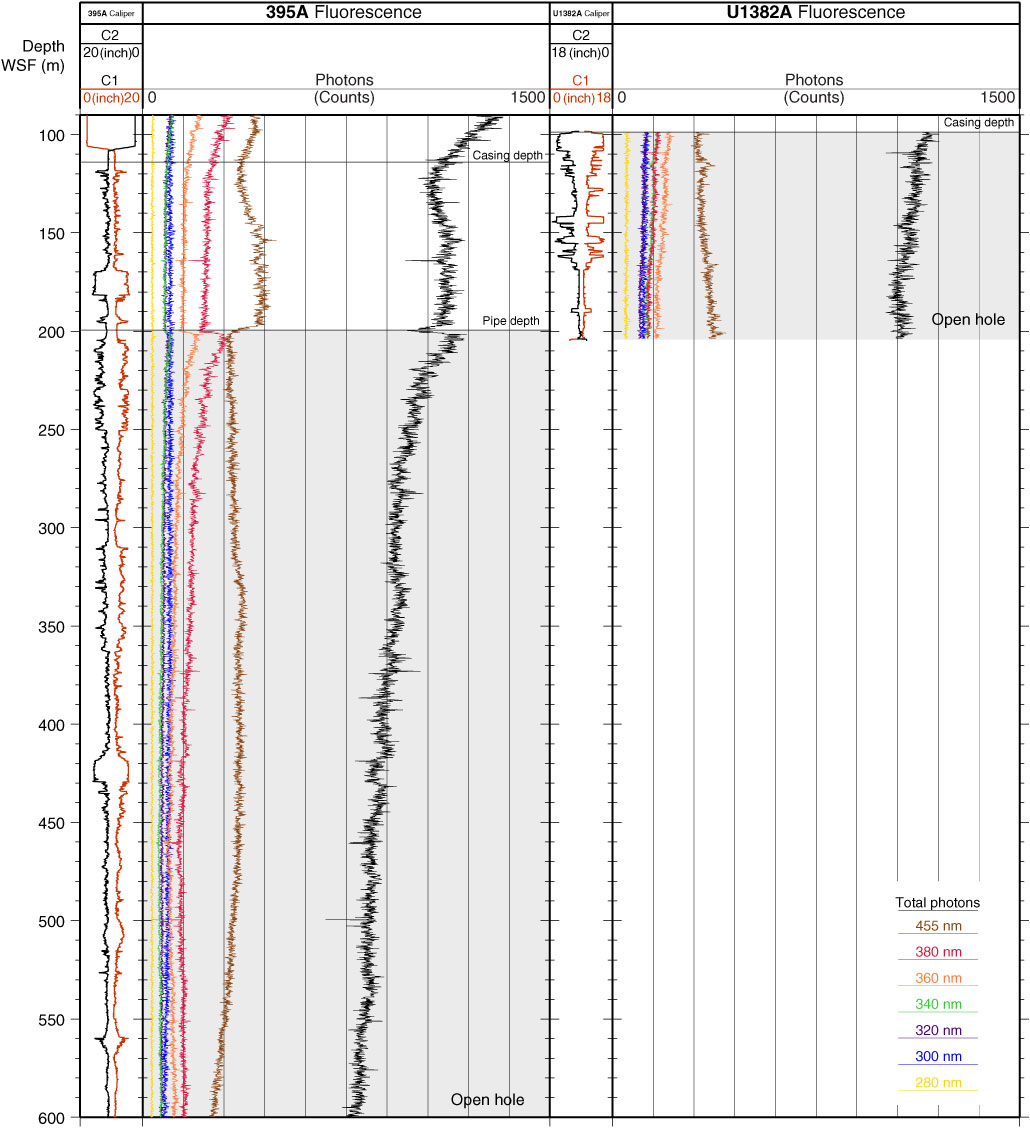
Figure F46. Summary comparing DEBI-t photon intensity data, Holes 395A and U1382A. The depth to which any pipe or casing was present is represented by a black line, and the shaded gray areas highlight the open-hole section.
Previous | Close | Next | Top of page