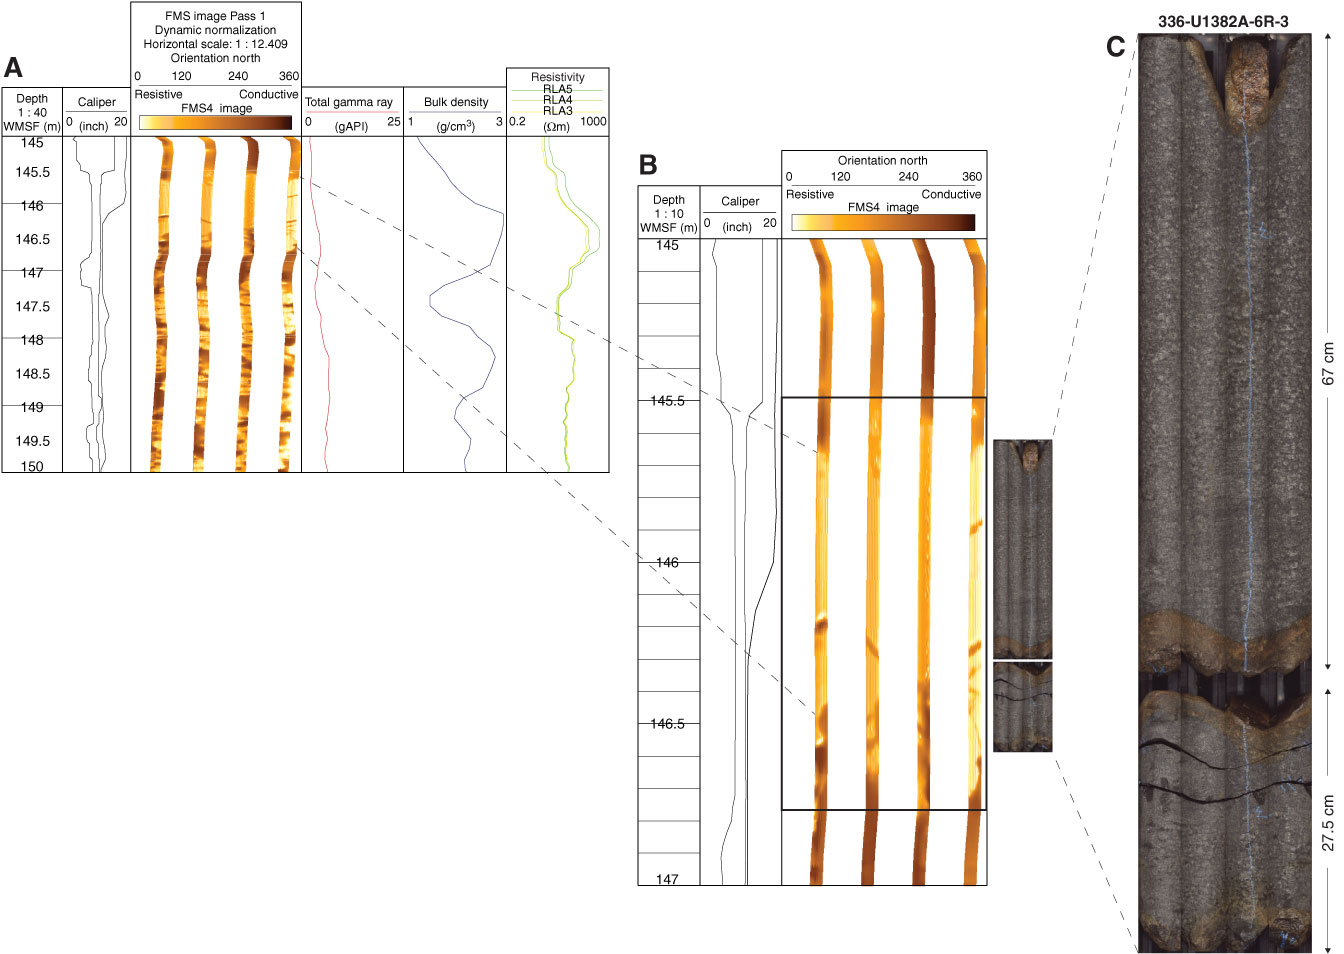
Figure F48. Composite showing preliminary core-log integration using core and Formation MicroScanner (FMS) imagery. A. Summary showing (from left to right) caliper logs (C1, C2 from FMS Pass 1 and single caliper [LCAL] from AMC I uplog), FMS dynamically normalized image showing a resistive boulder feature in Hole U1382A, total gamma ray curve, bulk density curve, and resistivity (RLA3-5 = medium to deep penetration measurement). B. Close-up of area of interest, with caliper measurement to the left of the FMS image. Core image to the right is set at the appropriate level on the image and lined up using the distinctive sinusoidal natural fracture (highlighted by the alteration halos on either side). C. High-resolution image of the outside of whole-round Section 336-U1382A-6R-3. The four images have been mosaicked together. Dashed lines = ties between A, B, and C.

Previous | Close | Next | Top of page