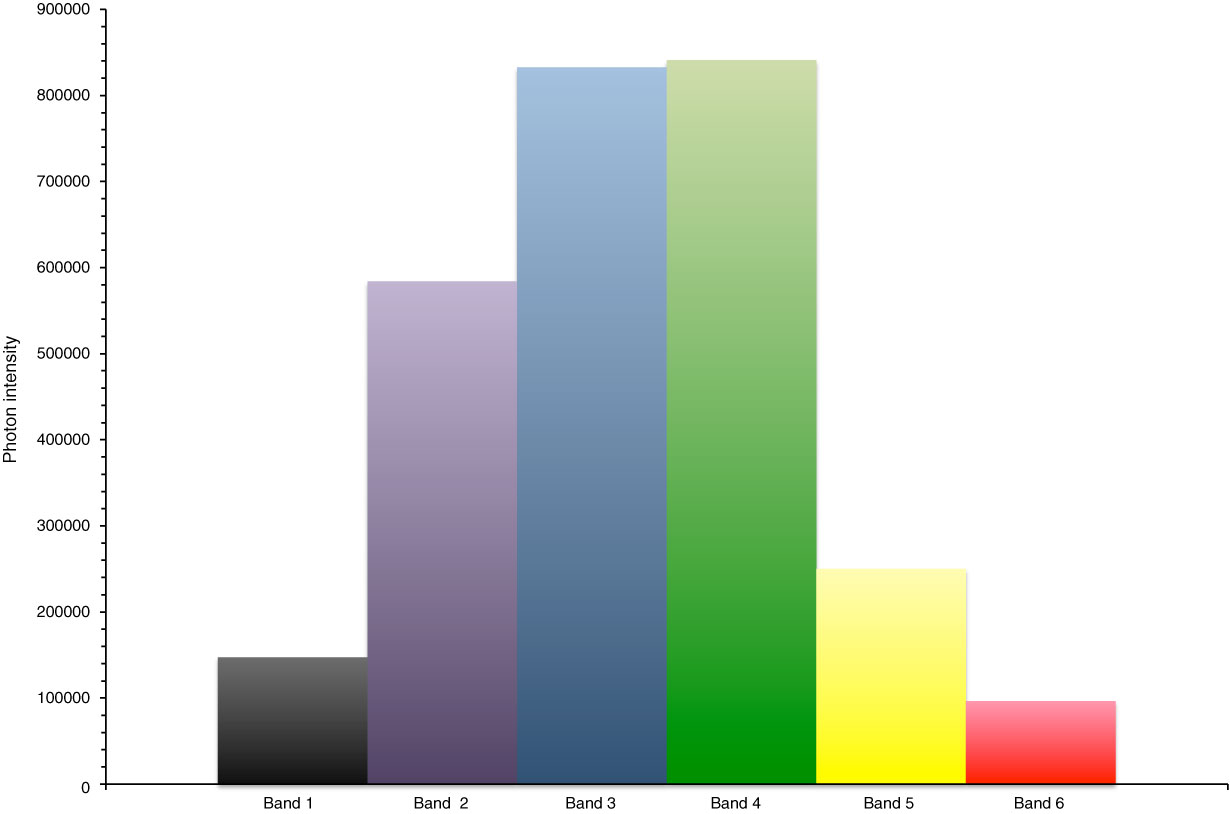
Figure F27. Fluorescence profile for pure microspheres. Each band (data not shown) represents a region of the fluorescence spectrum used by the DEBI-pt to characterize organic samples. Microspheres produce a unique fluorescence spectra with a peak emission at 320 nm when excited at 224 nm.
Previous | Close | Next | Top of page