Previous | Close | Next
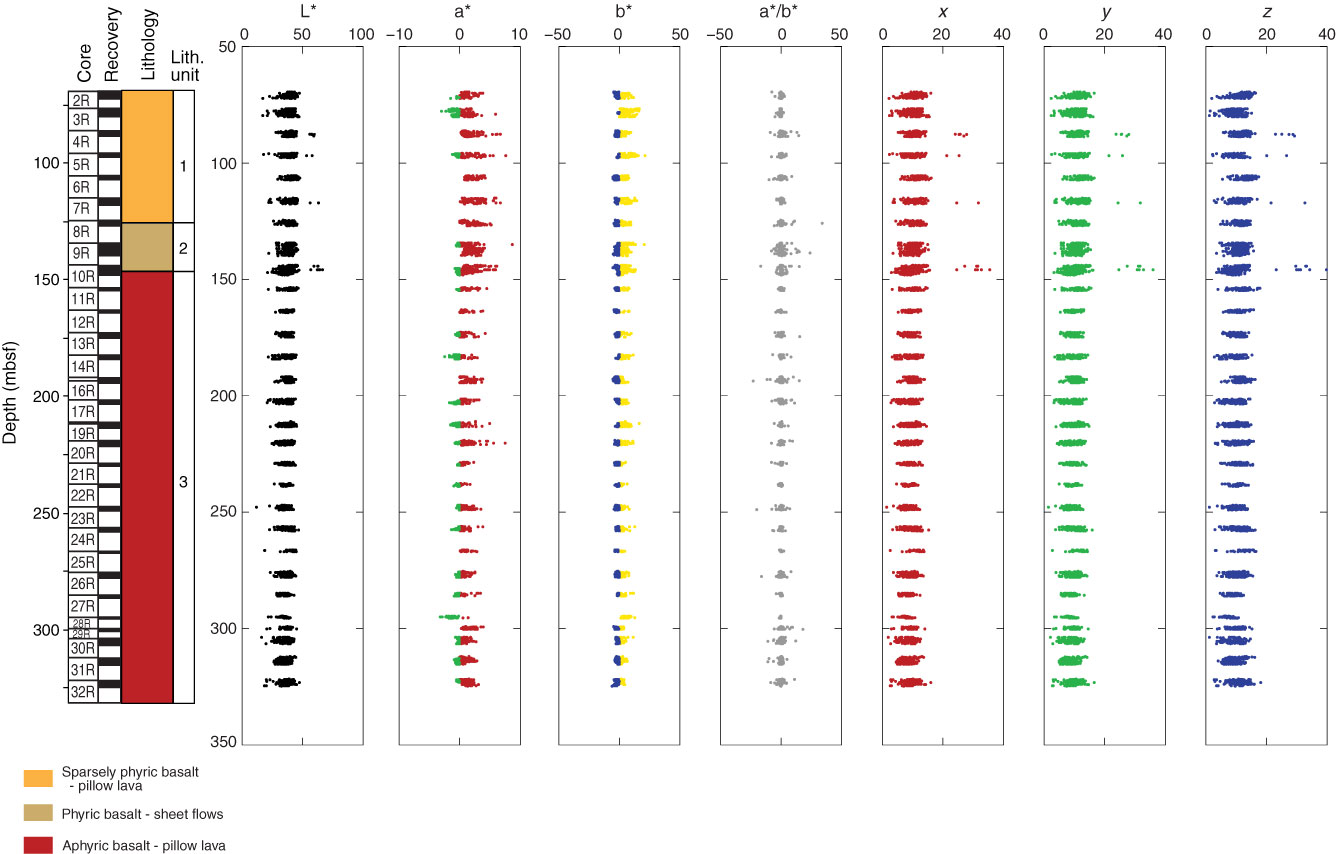
Figure F38. Plots of color reflectance and tristimulus axes values, Hole U1383C. L*, a* (green = negative, red = positive), b* (blue = negative, yellow = positive), and a*/b*.
Previous | Close | Next | Top of page