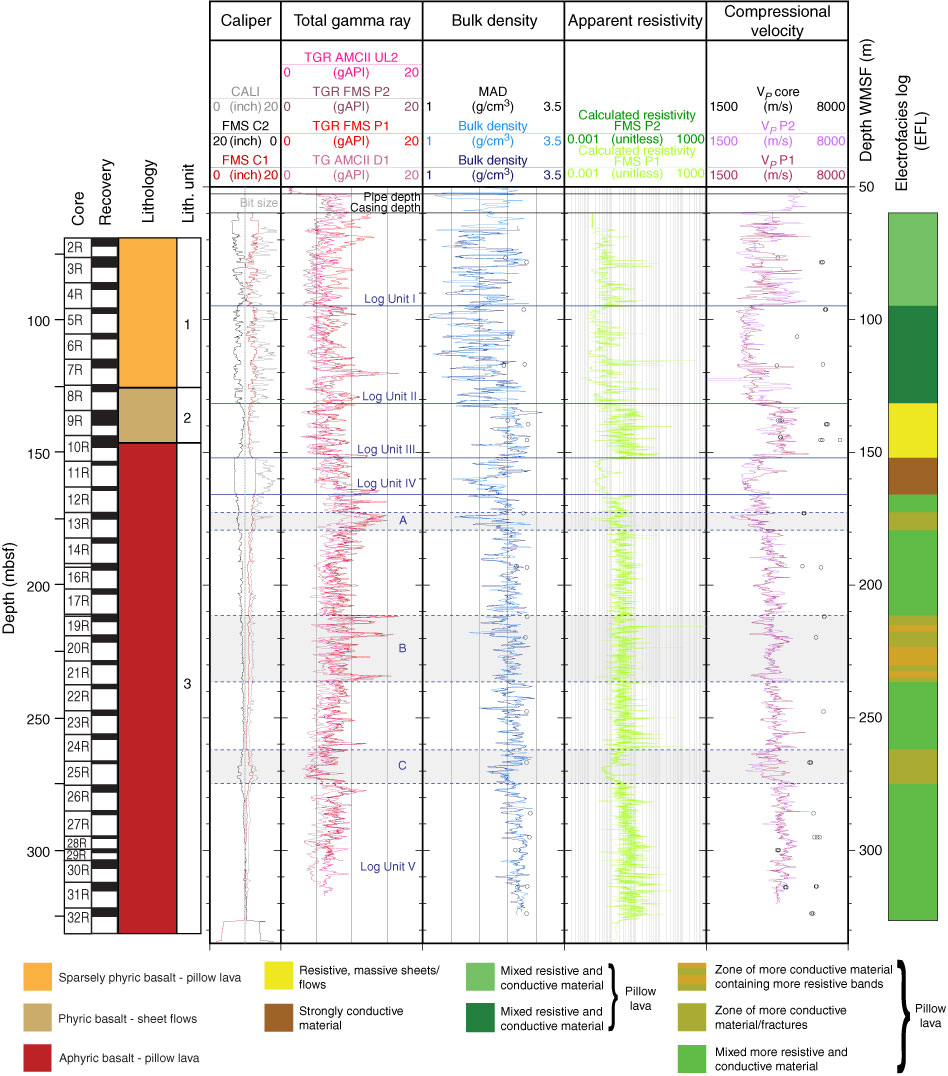
Figure F42. Summary of Hole U1383C logging results. Blue lines = log unit divisions, black lines = limits of pipe and casing. Measurements include borehole diameter (CALI = adapted microbiology combination II (AMC II) Uplog 1; FMS C1, C2 = Formation MicroScanner (FMS) Pass 1), total gamma ray (TGR) (AMCII UL2 = AMC II Uplog 2, FMS P1 = FMS-sonic Pass 1, FMS P2 = FMS-sonic Pass 2, AMCII D1 = AMC II Downlog 1), density (bulk density = AMC II Uplogs 1 and 2; MAD = moisture and density testing on discrete core samples), apparent resistivity (FMS P2 = FMS pad average from Pass 1, FMS P1 = FMS pad average from Pass 2), compressional velocity (VP core = from discrete core cube samples, VP P1 = FMS-sonic Pass 1, P2 = FMS-sonic Pass 2). A summary of core recovery and lithologic units is provided at the far left (see Fig. F4 for full explanation), and on the far right is electrical stratigraphy based on FMS electrical images.

Previous | Close | Next | Top of page