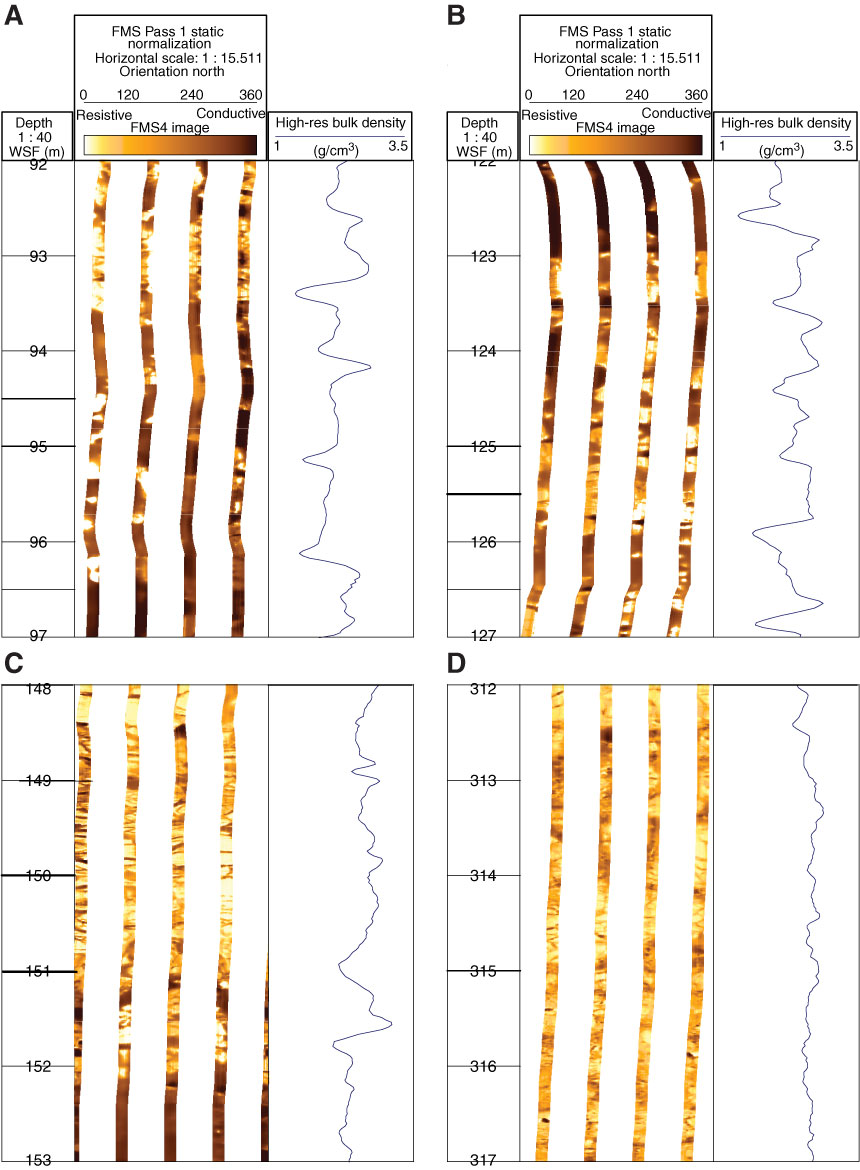
Figure F46. Composite of features imaged by the Formation MicroScanner (FMS), Hole U1383C. Note that images here are shown from Pass 1 of the FMS-sonic tool string. A. Boundary between log Units I and II, moving from more a resistive to more conductive region. B. Typical section in log Unit II. C. Nature of boundary between log Units III and IV. D. Zone of typical pillow lavas visible in log Unit IV. A high-resolution bulk density curve (in blue) is shown to the right of each FMS image for information.
Previous | Close | Next | Top of page