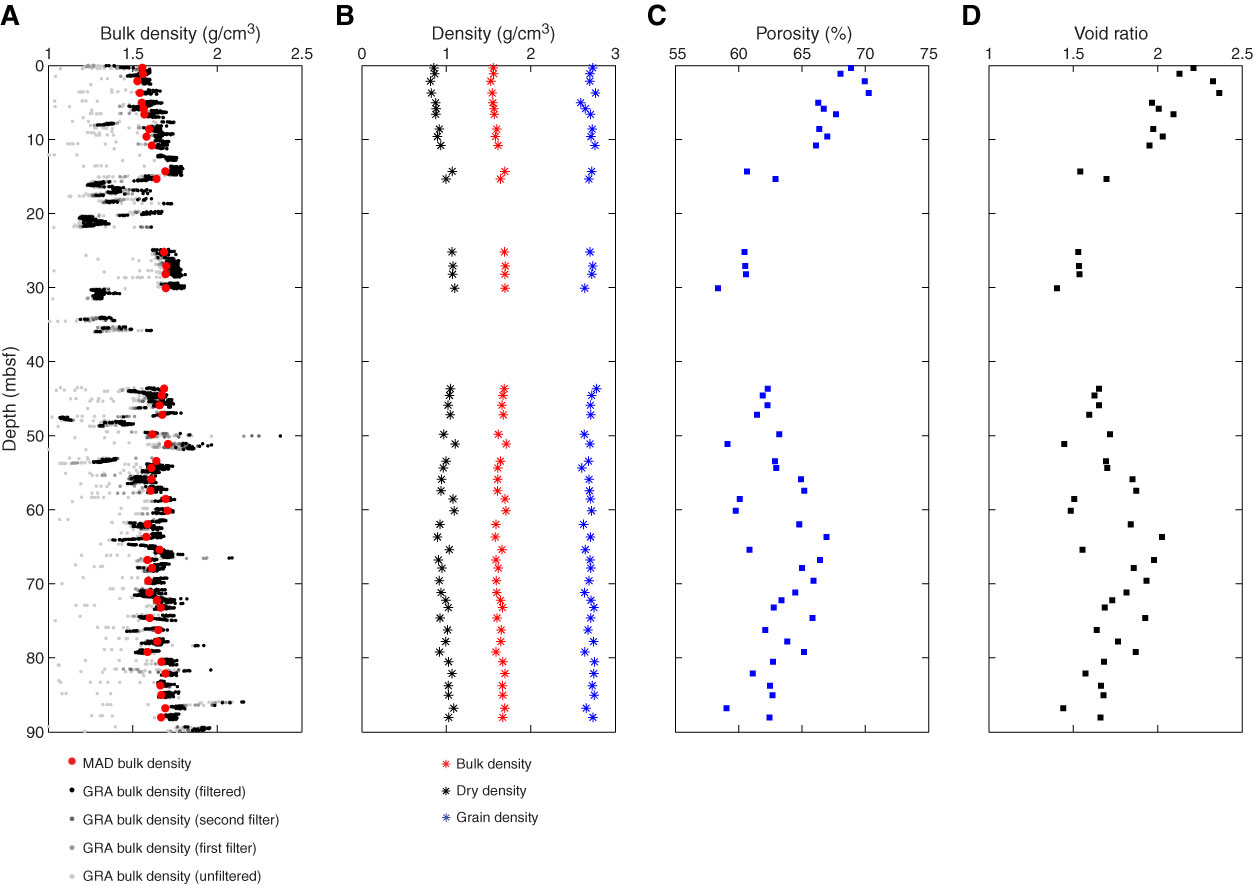
Figure F10. Plots of gamma ray attenuation (GRA) density and moisture and density (MAD) measurements, Hole U1382B. A. GRA bulk density and MAD density from discrete measurements. Shades of gray indicate levels of filtered data. B. Bulk, dry, and grain densities calculated for discrete samples. C. Porosity. D. Void ratio.
Previous | Close | Next | Top of page