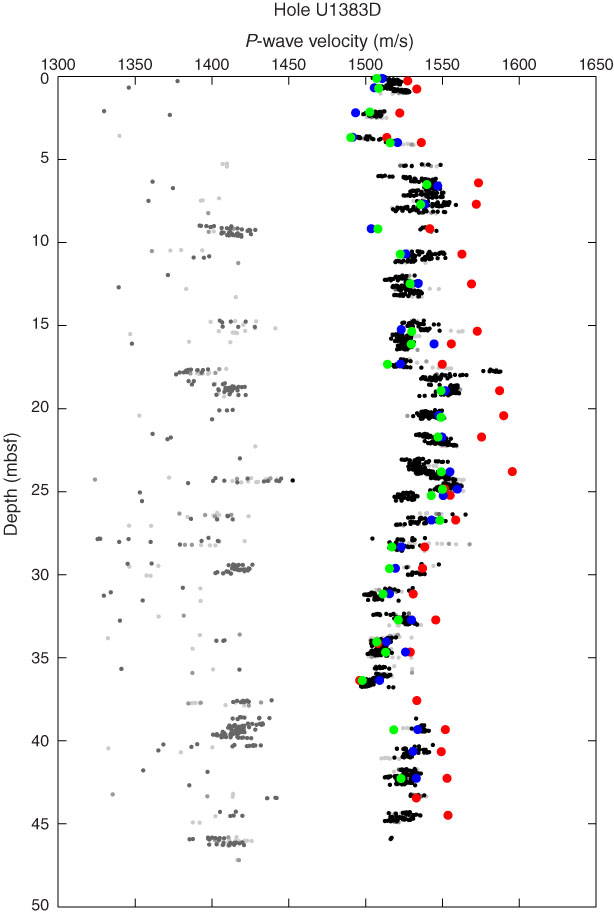
Figure F20. Plot of compressional P-wave velocity measurements for x- (red), y- (green), and z- (blue) axes with the caliper and bayonets, respectively, and filtered (black) and unfiltered (gray) values for P-wave velocities measured with the WRMSL, Hole U1383D.
Previous | Close | Next | Top of page