Previous | Close | Next
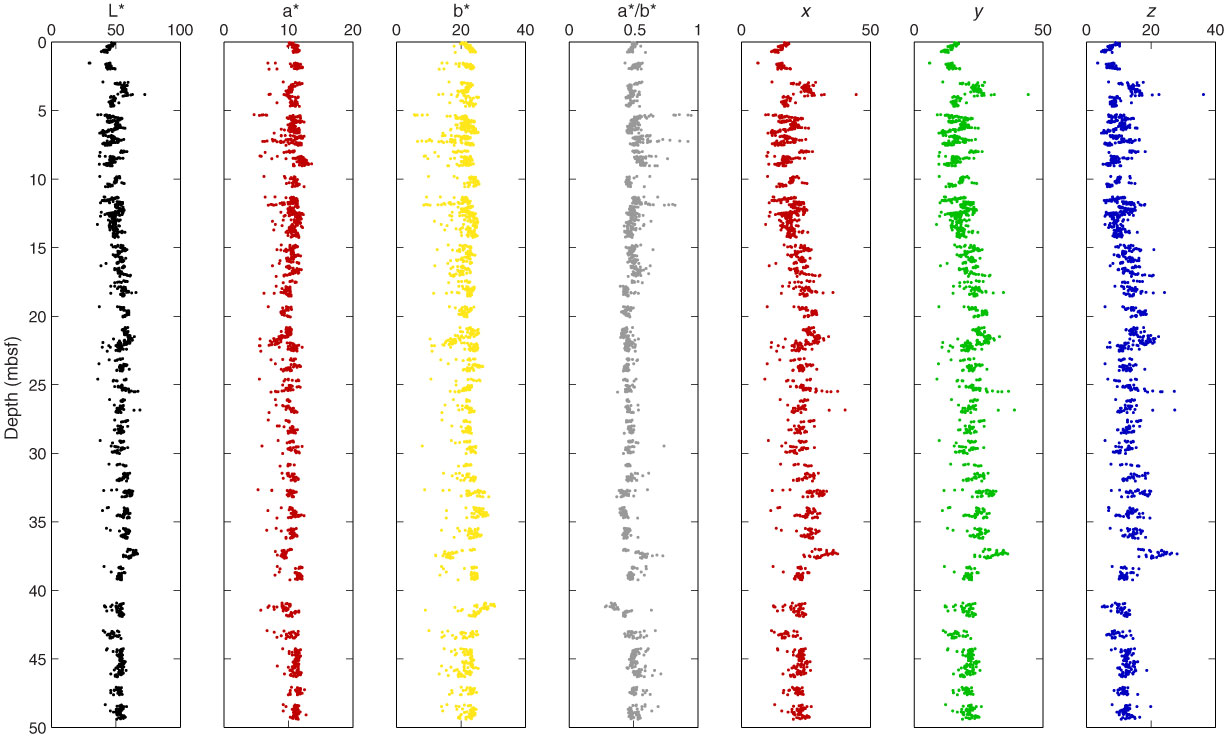
Figure F25. Plots of color reflectance and tristimulus axes values, Hole U1383E.
Previous | Close | Next | Top of page