Previous | Close | Next
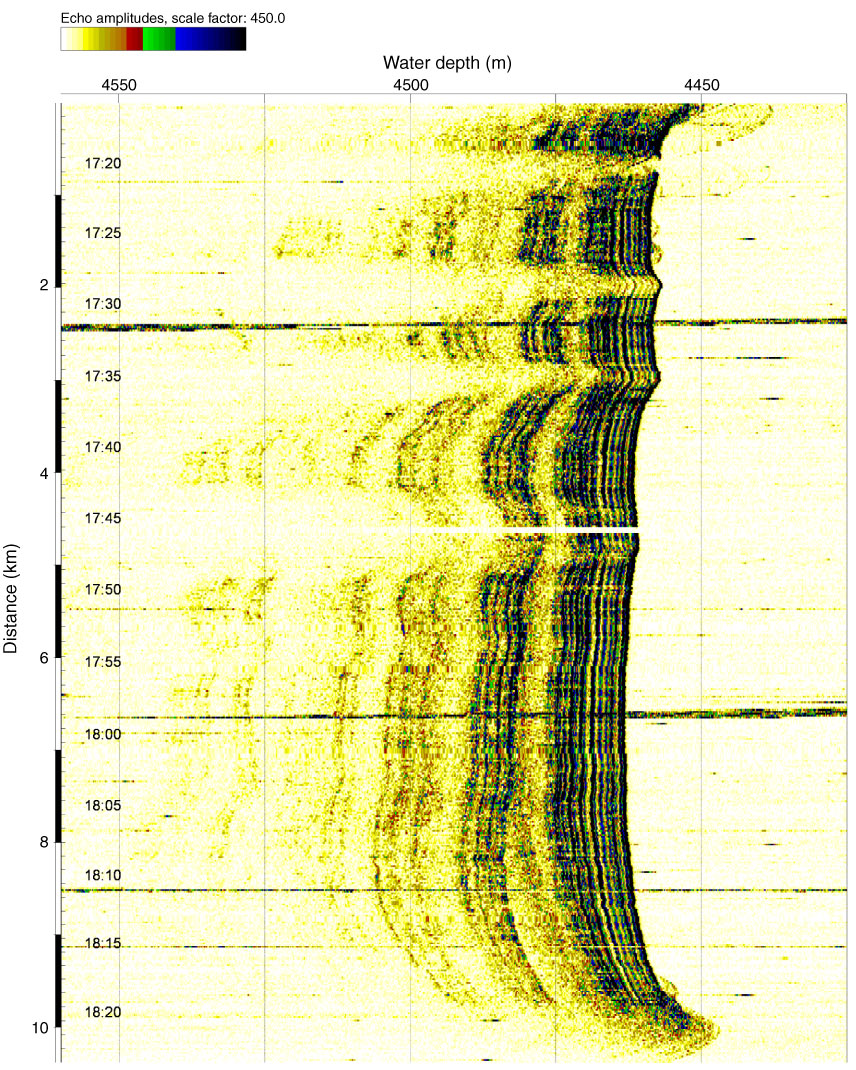
Figure F6. Parasound Profile 10. See Figure F5 for profile location (bold white line). Vertical exaggeration = ~80.
Previous | Close | Next | Top of page