Previous | Close | Next
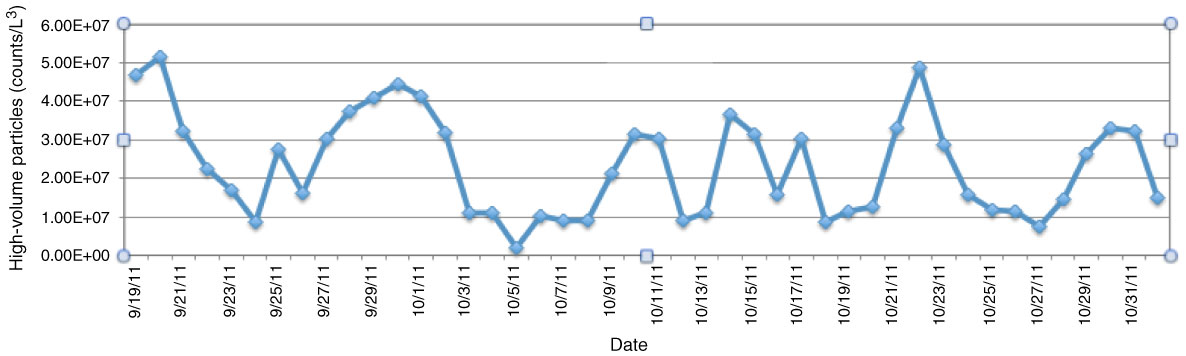
Figure F2. Daily average of particle counts per cubic liter of air for the high-volume sample time period (~24 h; 0645 h to 0715 h EST the following day).
Previous | Close | Next | Top of page