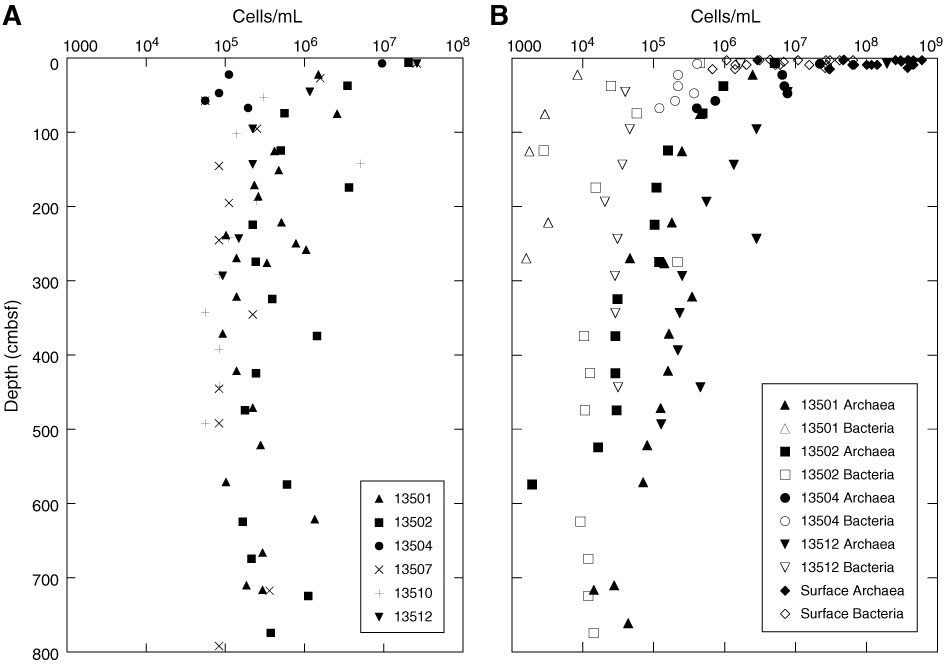
Figure F3. (A) Total cell counts and (B) qPCR abundance of Bacteria and Archaea in organic-lean, oligotrophic, and oxic North Pond subsurface marine sediments (sampling sites Geob 13501, 13502, 13504, 13507, 13510, 13512 [Ziebis et al., 2012]). Near-surface samples taken with push cores (upper 15 cmbsf) were only analyzed by qPCR.
Previous | Close | Top of page