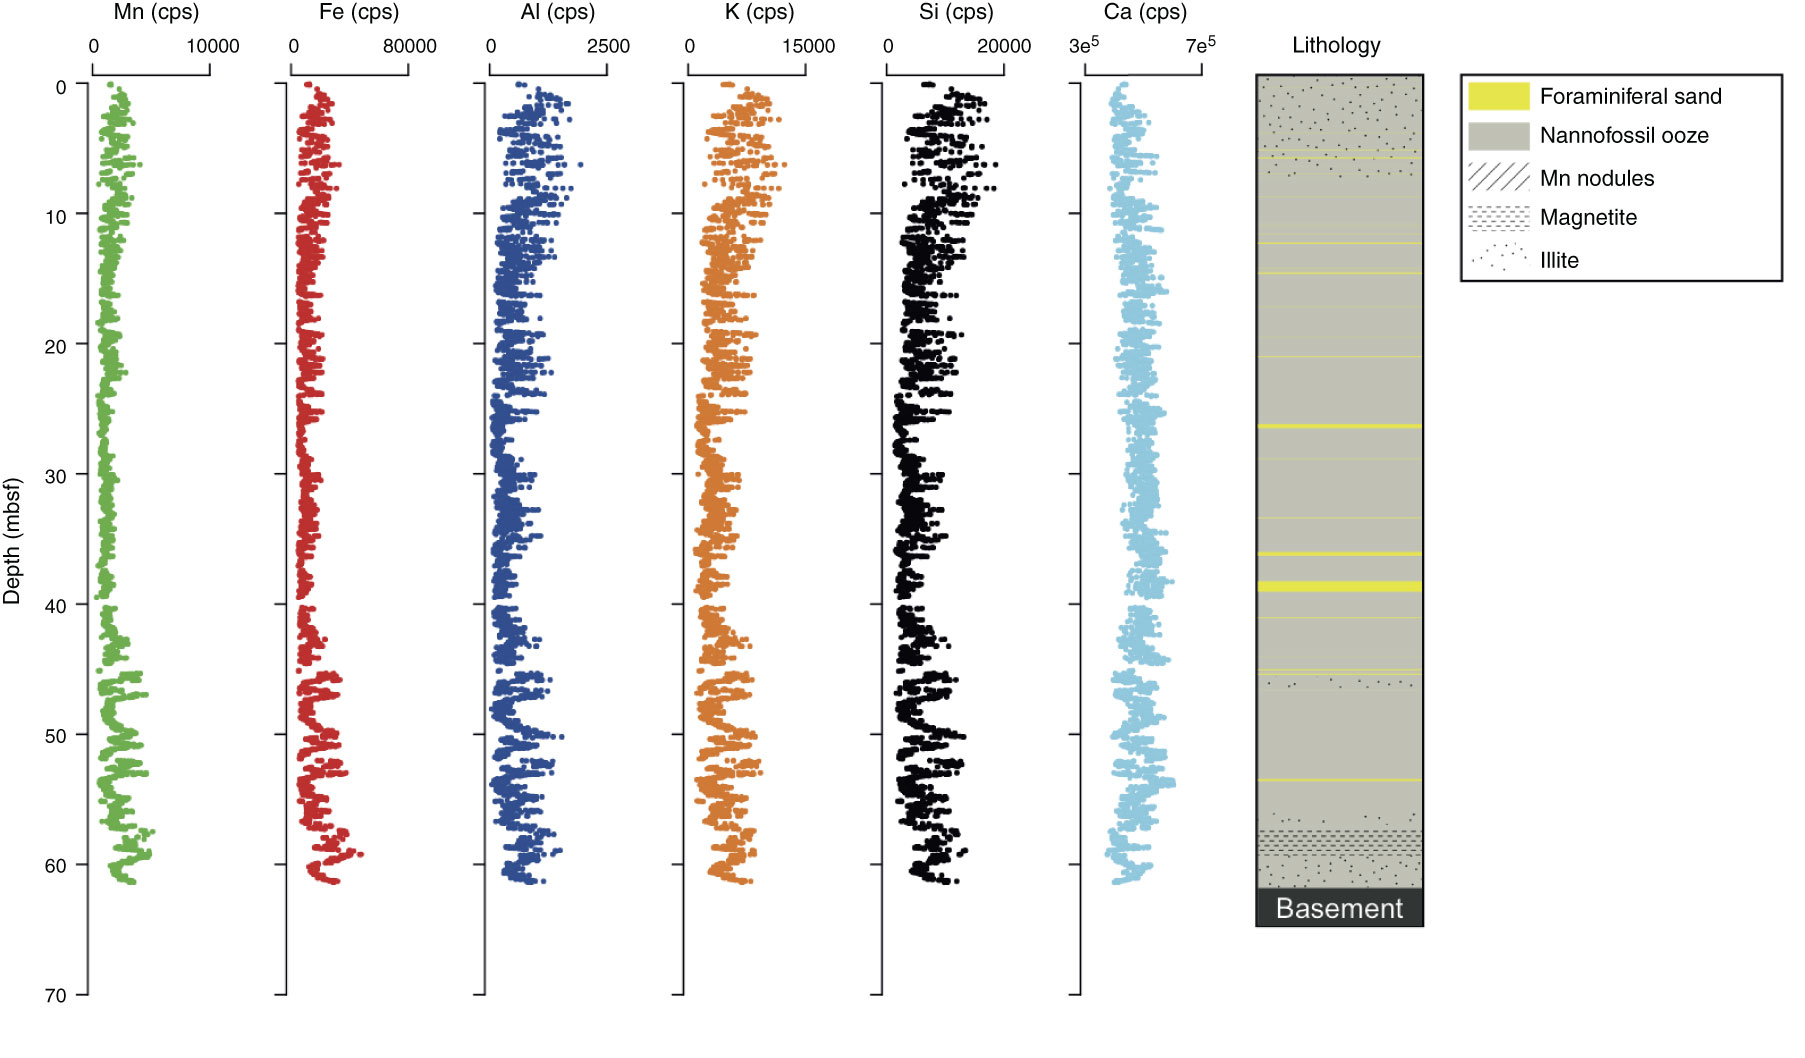
Figure F4. X-ray fluorescence scanner intensities for Mn, Fe, Al, K, Si, and Ca, Hole 1074A. The lithology column was created based on geochemical and supplementary susceptibility and natural gamma ray data. Dashed lines indicate criteria used for lithostratigraphic units. Alternative versions of this figure with Ca/totals and log(Ca/Al) can be found in XRFDATA in “Supplementary material.”
Previous | Close | Top of page