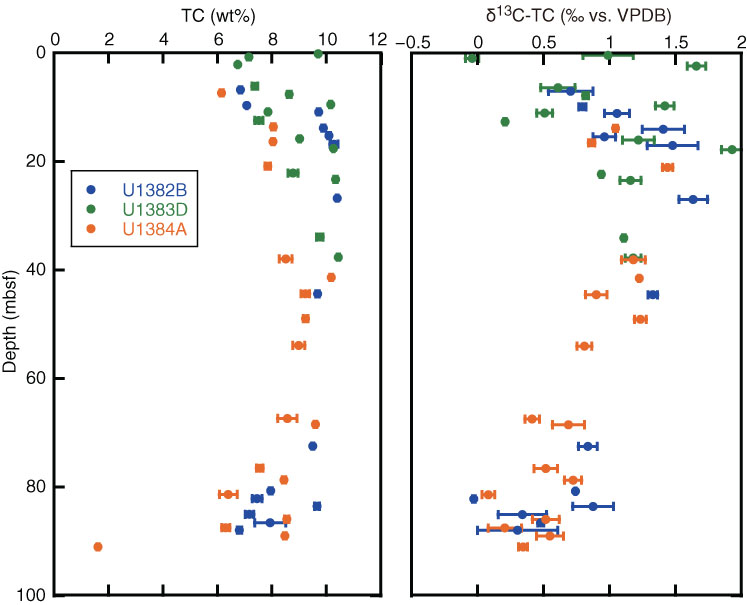
Figure F2. Total carbon (TC) content and δ13C-TC of sediments, Holes U1382B, U1383D, and U1384A. We analyzed each sample twice. Plots = average values. Error bars = ranges between minimum and maximum values. VPDB = Vienna Peedee belemnite.
Previous | Close | Next | Top of page