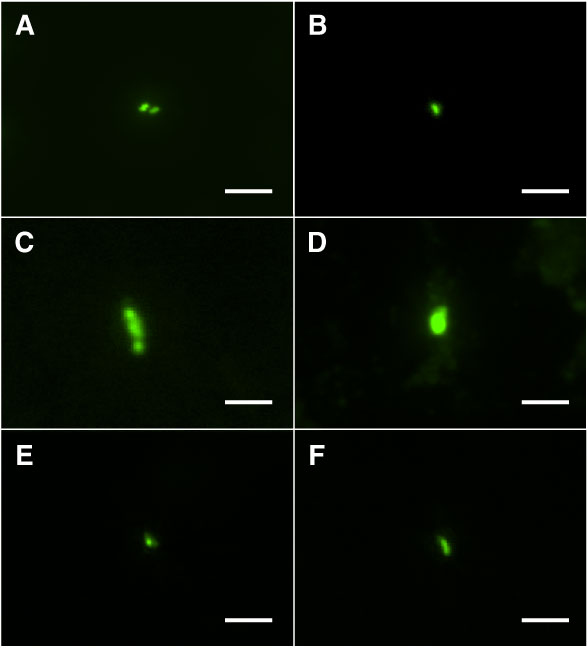
Figure F14. Fluorescent microscopic images of microbial cells from core samples. Each picture shows SYBR Green I-stained microbial cells observed in Sections (A) 337-C0020A-1R-2 (1278 m CSF-B), (B) 15R-2 (1920 m CSF-B), (C) 25R-2 (1997 m CSF-B), (D) 26R-7 (2117 m CSF-B), and (E, F) 32R-1 (2457 m CSF-B). Scale bars = 3 µm.
Previous | Close | Next | Top of page