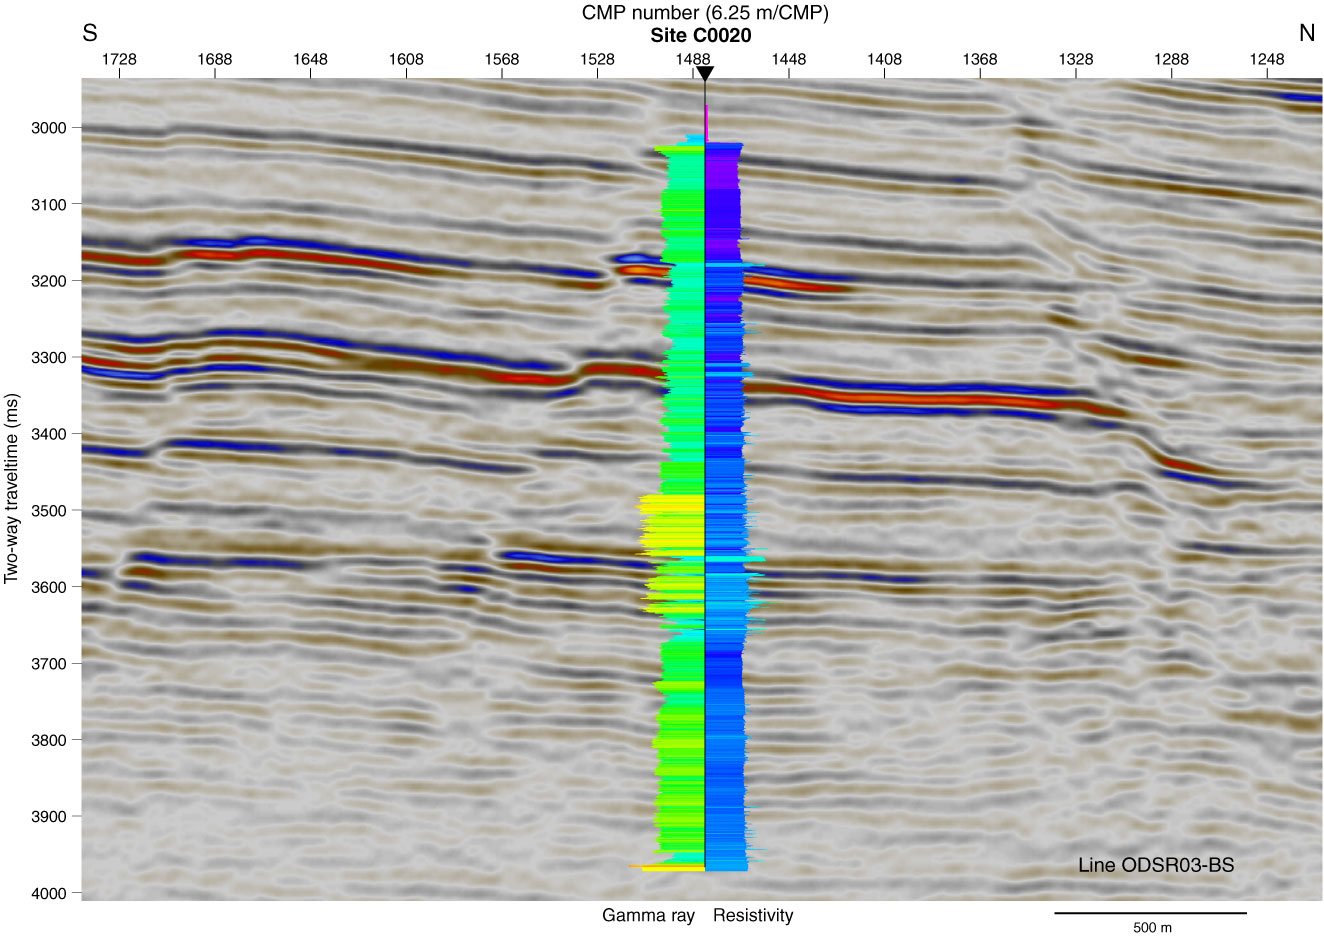
Figure F13. Correlation of seismic profile and logging data, Site C0020. Gamma ray and resistivity log data are displayed along the well. The layers of high resistivity correspond to the top horizon of the strong reflection zones on the profile. CMP = common midpoint.
Previous | Close | Next | Top of page