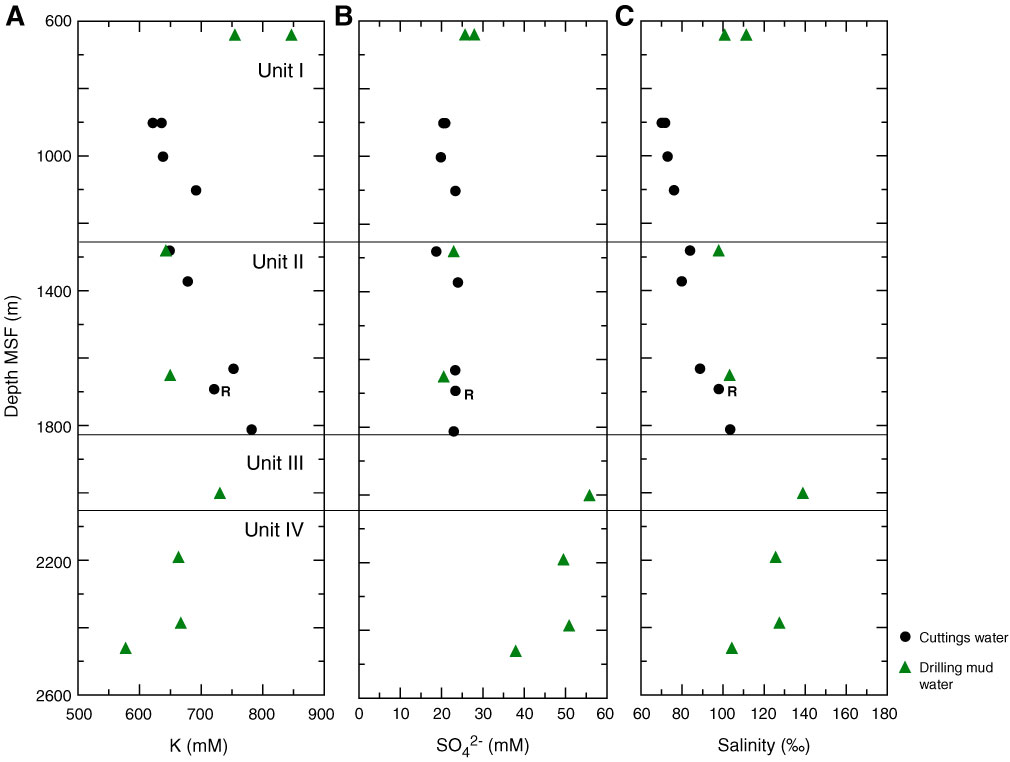
Figure F24. Plots of (A) potassium and (B) sulfate concentrations as well as (C) salinity for cuttings samples collected at Site C0020 and drilling mud samples collected prior to, during, and after drilling operations. R = cuttings sample measured with the Rhizon sampler.
Previous | Close | Next | Top of page