Previous | Close | Next
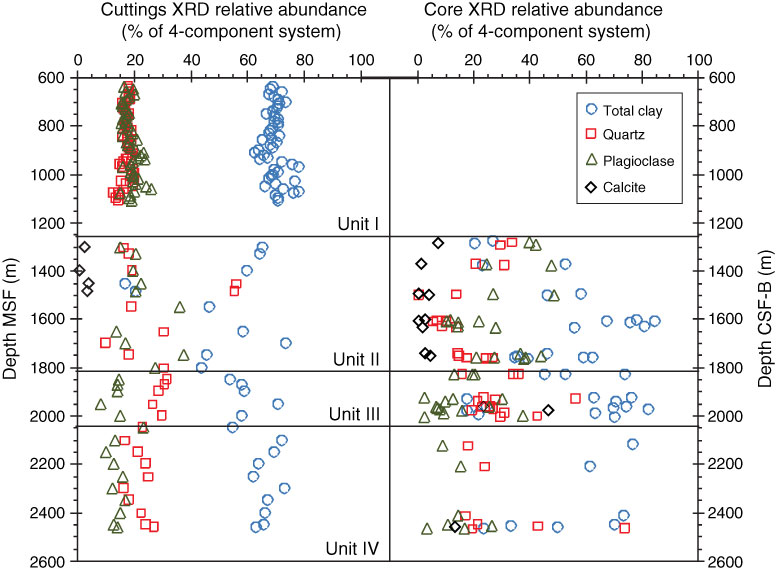
Figure F5. Plot of downhole changes in the relative abundance of quartz, feldspar, clay, and calcite derived from X-ray diffraction (XRD) measurements, Hole C0020A.
Previous | Close | Next | Top of page