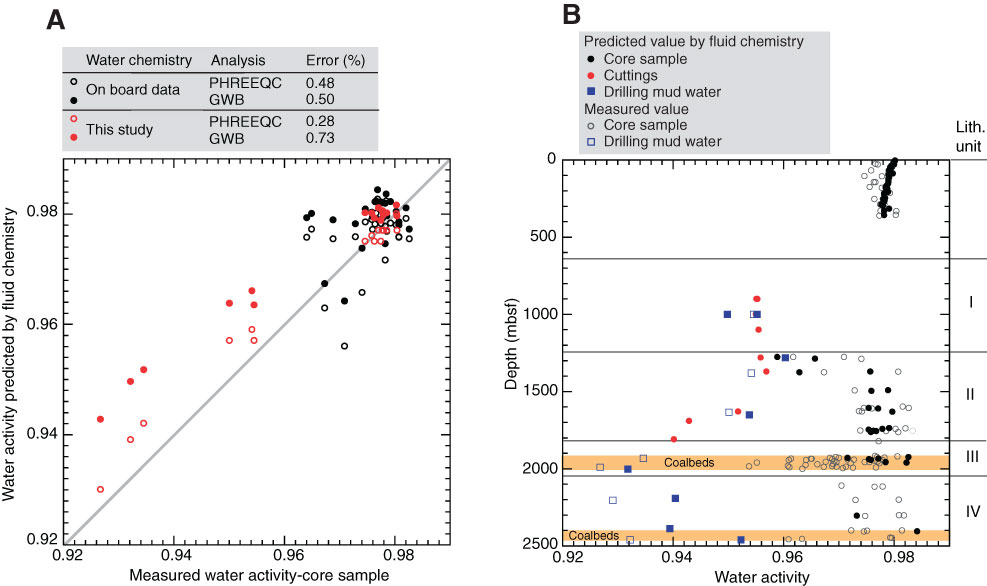
Figure F5. A. Comparison of measured water activity and predicted water activity of core samples. Mean absolute percentage deviations between measured and predicted values are shown on the same figure. B. Depth profiles of predicted water activity at Site C0020. Predicted water activity was calculated from pore water chemistry data measured on the ship (core sample and cuttings) and in this study (drilling mud water). Fluid chemistry data from Expedition 902 newly measured in this study was not used to predict the water chemistry in B.
Previous | Close | Top of page