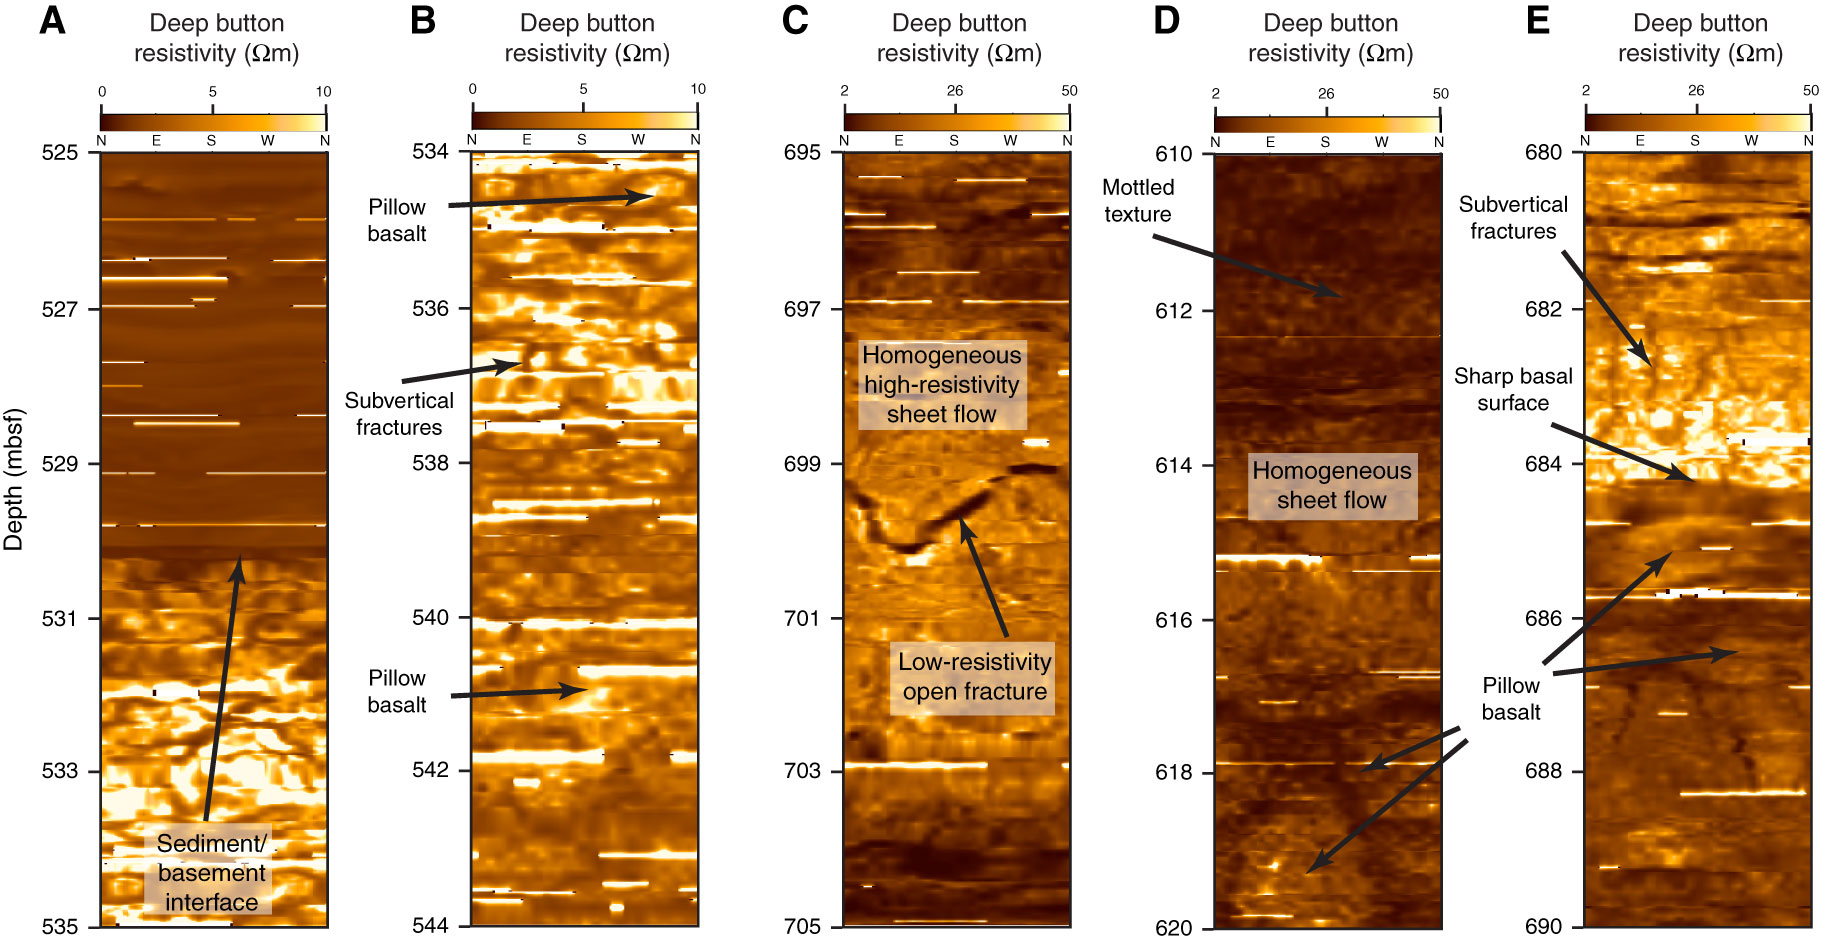
Figure F17. Static deep button resistivity images showing textures and fractures observed in oceanic basement, Hole C0012H. A. Irregular surface (i.e., nonplanar) at the sediment/basement interface (~530 mbsf). B. Logging Subunit VIIA contains frequent variations in textural patterns (every 5 m or less), showing pillow basalt and a sheet flow with subvertical fractures. C. Large, high-angle (~75°) low-resistivity (<7 Ωm) fracture bisecting a homogeneous sheet flow in logging Subunit VIIB. D. All three basement textures (mottled, turtleshell, and homogeneous zones) observed in logging Subunit VIIC. E. A sharp drop in resistivity marks the transition from a homogeneous zone to a region of turtleshell texture at ~684 mbsf in logging Unit VIII. This is interpreted as the basal surface of the sheet flow, and several other (less distinct) surfaces are observed throughout both basement units. A and B are plotted on the medium range resistivity scale (0–10 Ωm); C–E are plotted on the high range resistivity scale (2–50 Ωm).

Previous | Close | Next | Top of page