Previous | Close | Next
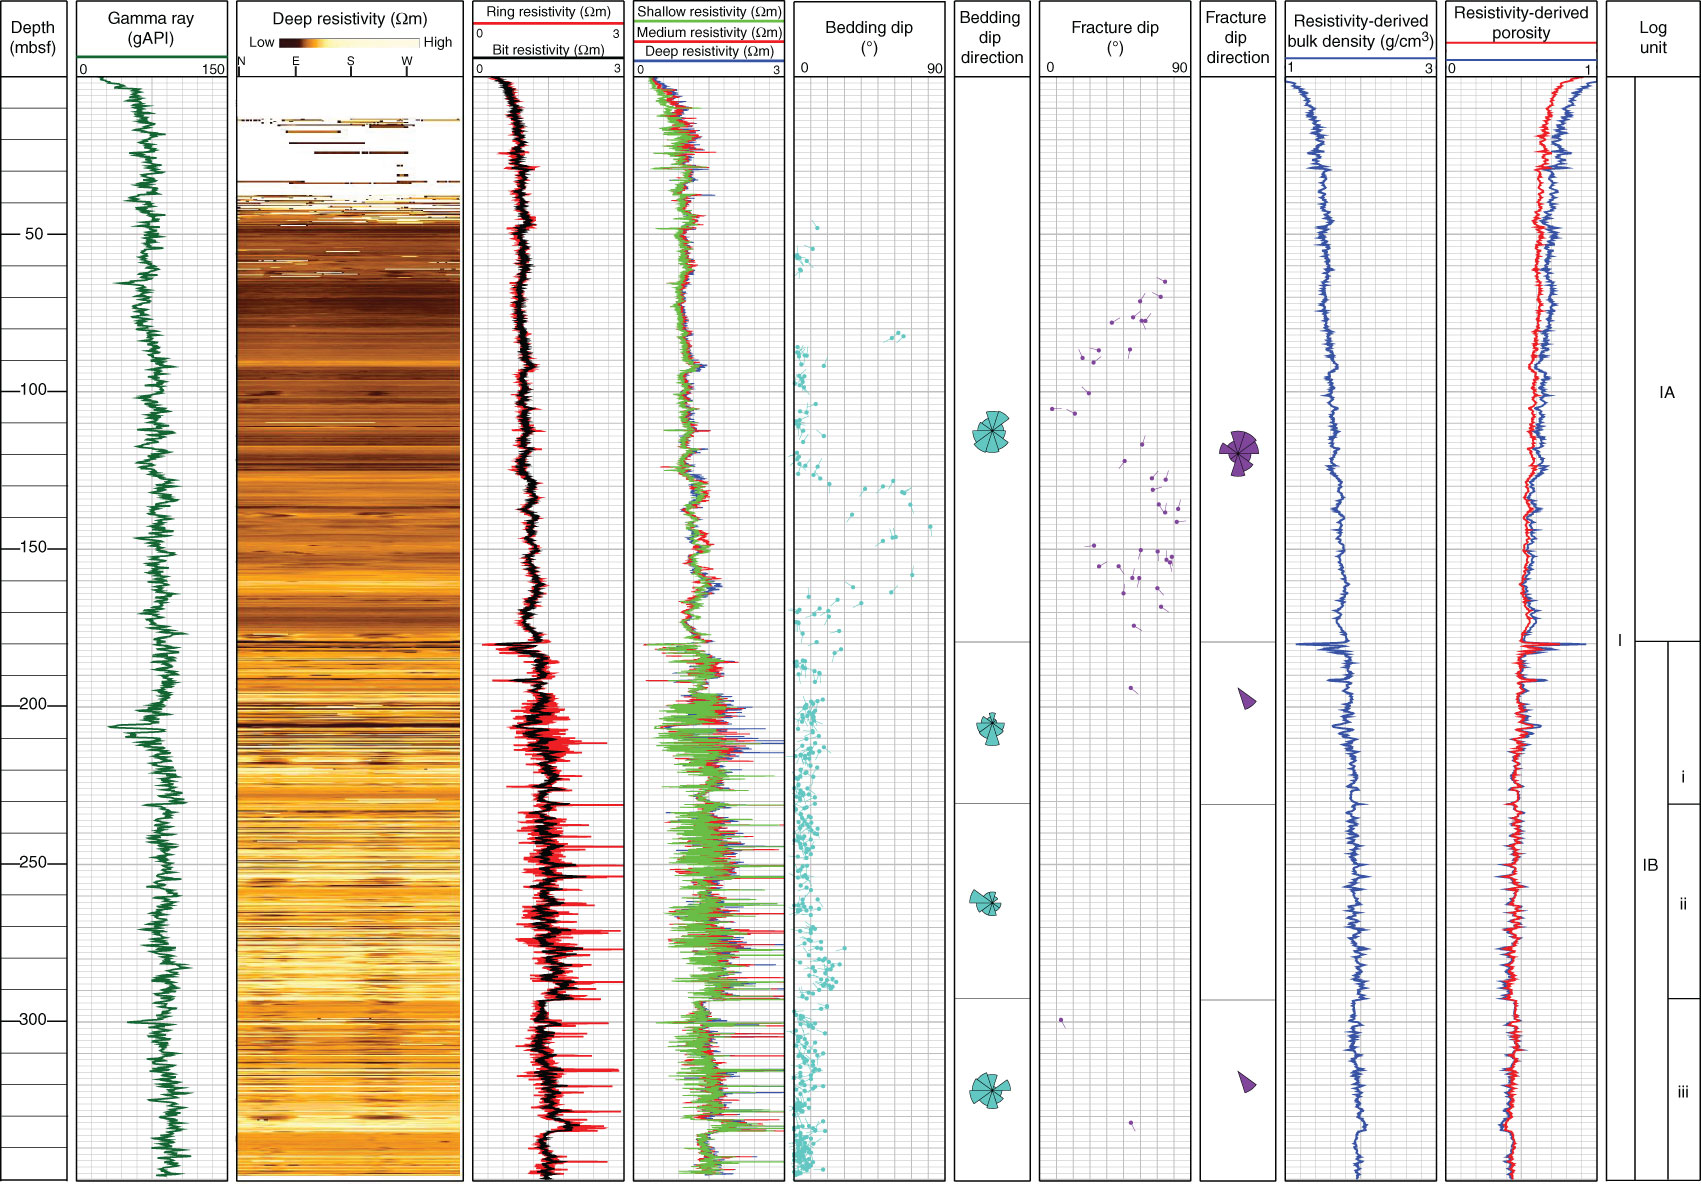
Figure F19. Composite plot, Hole C0018B: LWD, deep resistivity image, resistivity-derived porosity (red = Expedition 314, blue = Hole C0018A MAD data) and bulk density, and bedding and fracture dips.
Previous | Close | Next | Top of page