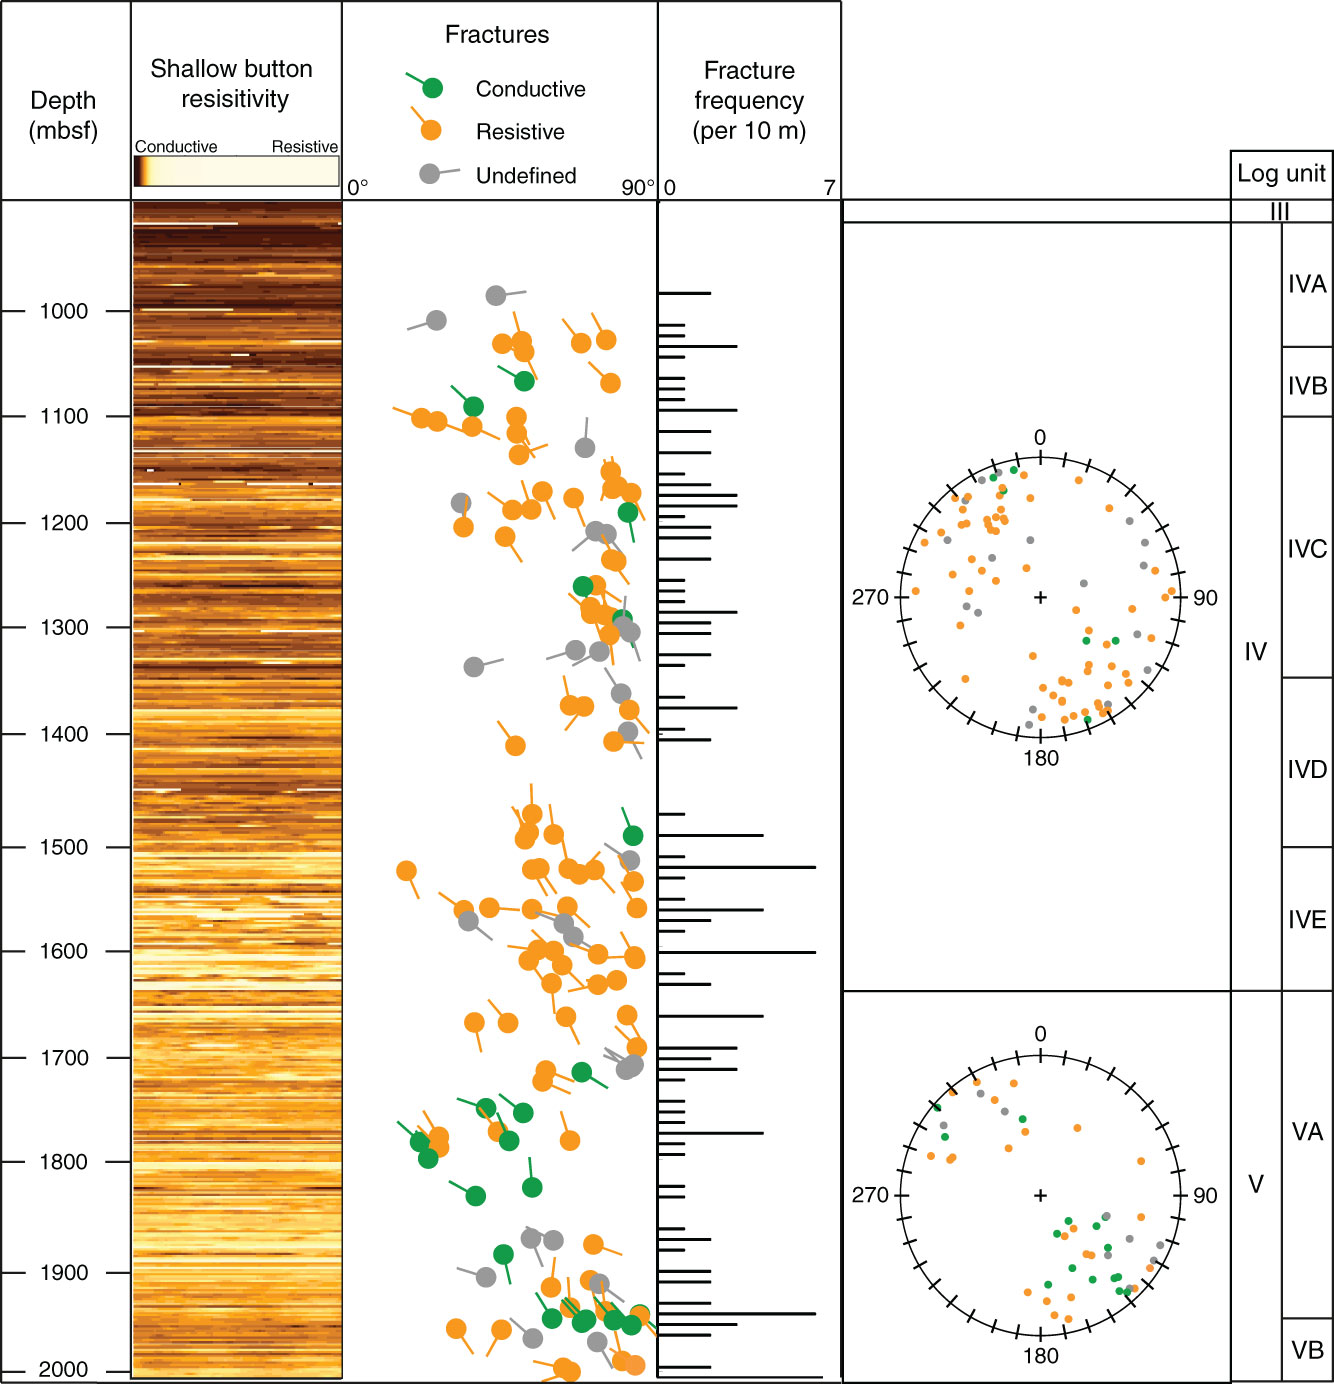
Figure F10. Shallow button resistivity image, fracture orientations, and fracture frequency, Hole C0002F. Fracture counts were normalized over 10 m intervals to show areas of higher fracture concentration. Also shown are equal area lower hemisphere stereonets for all of the poles to fracture planes, separated by logging unit.
Previous | Close | Next | Top of page