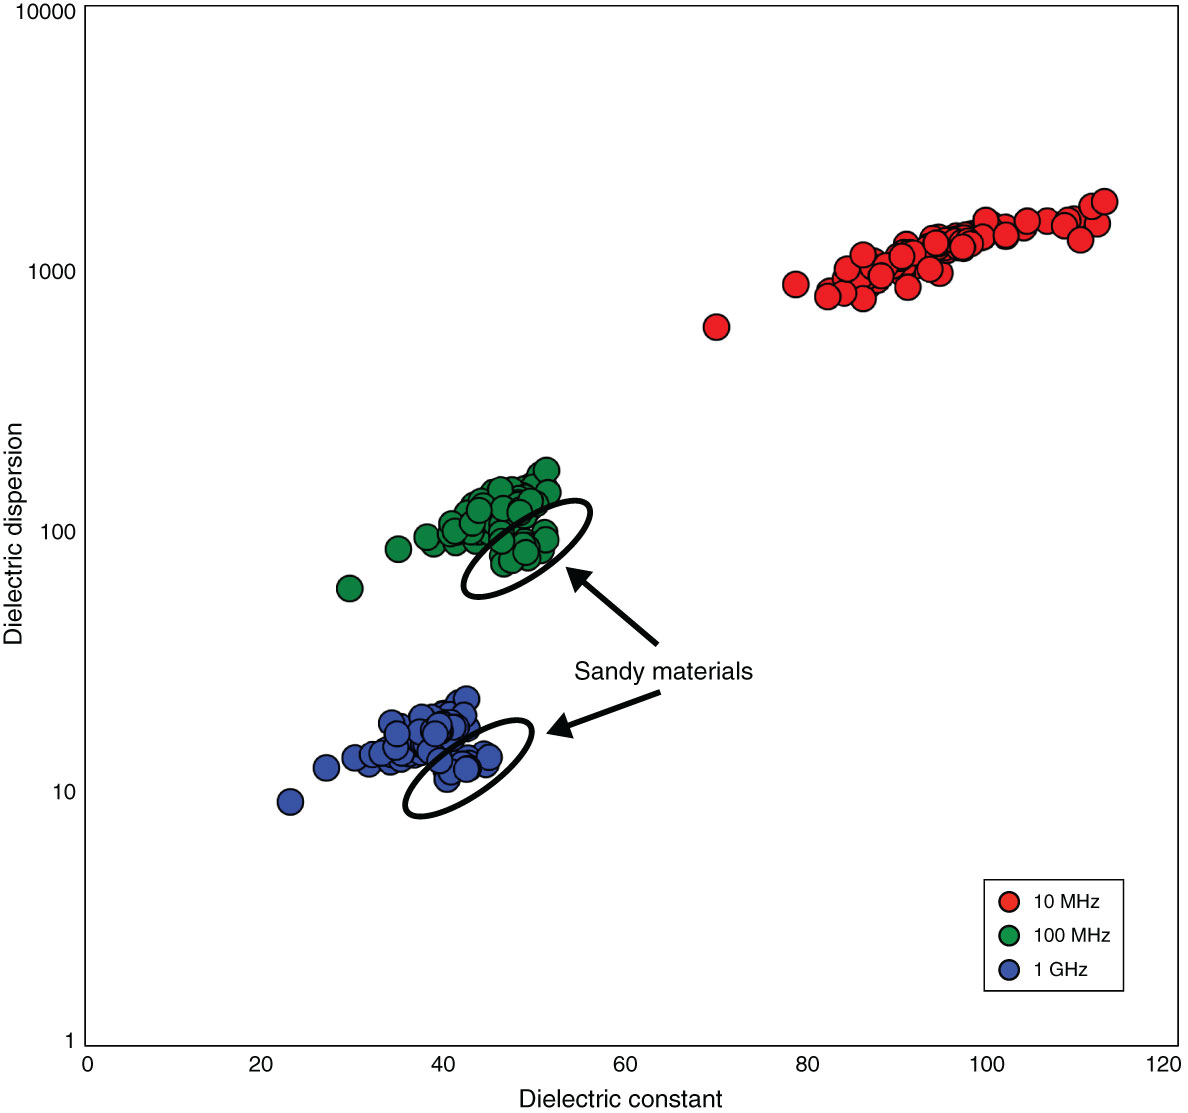
Figure F107. Comparison of the dielectric dispersion with the dielectric constant at three measurement frequencies on all the cuttings pastes, Hole C0002F. Note the sandy materials cloud out of the general trend at 100 MHz and 1 GHz.
Previous | Close | Next | Top of page