Previous | Close | Next
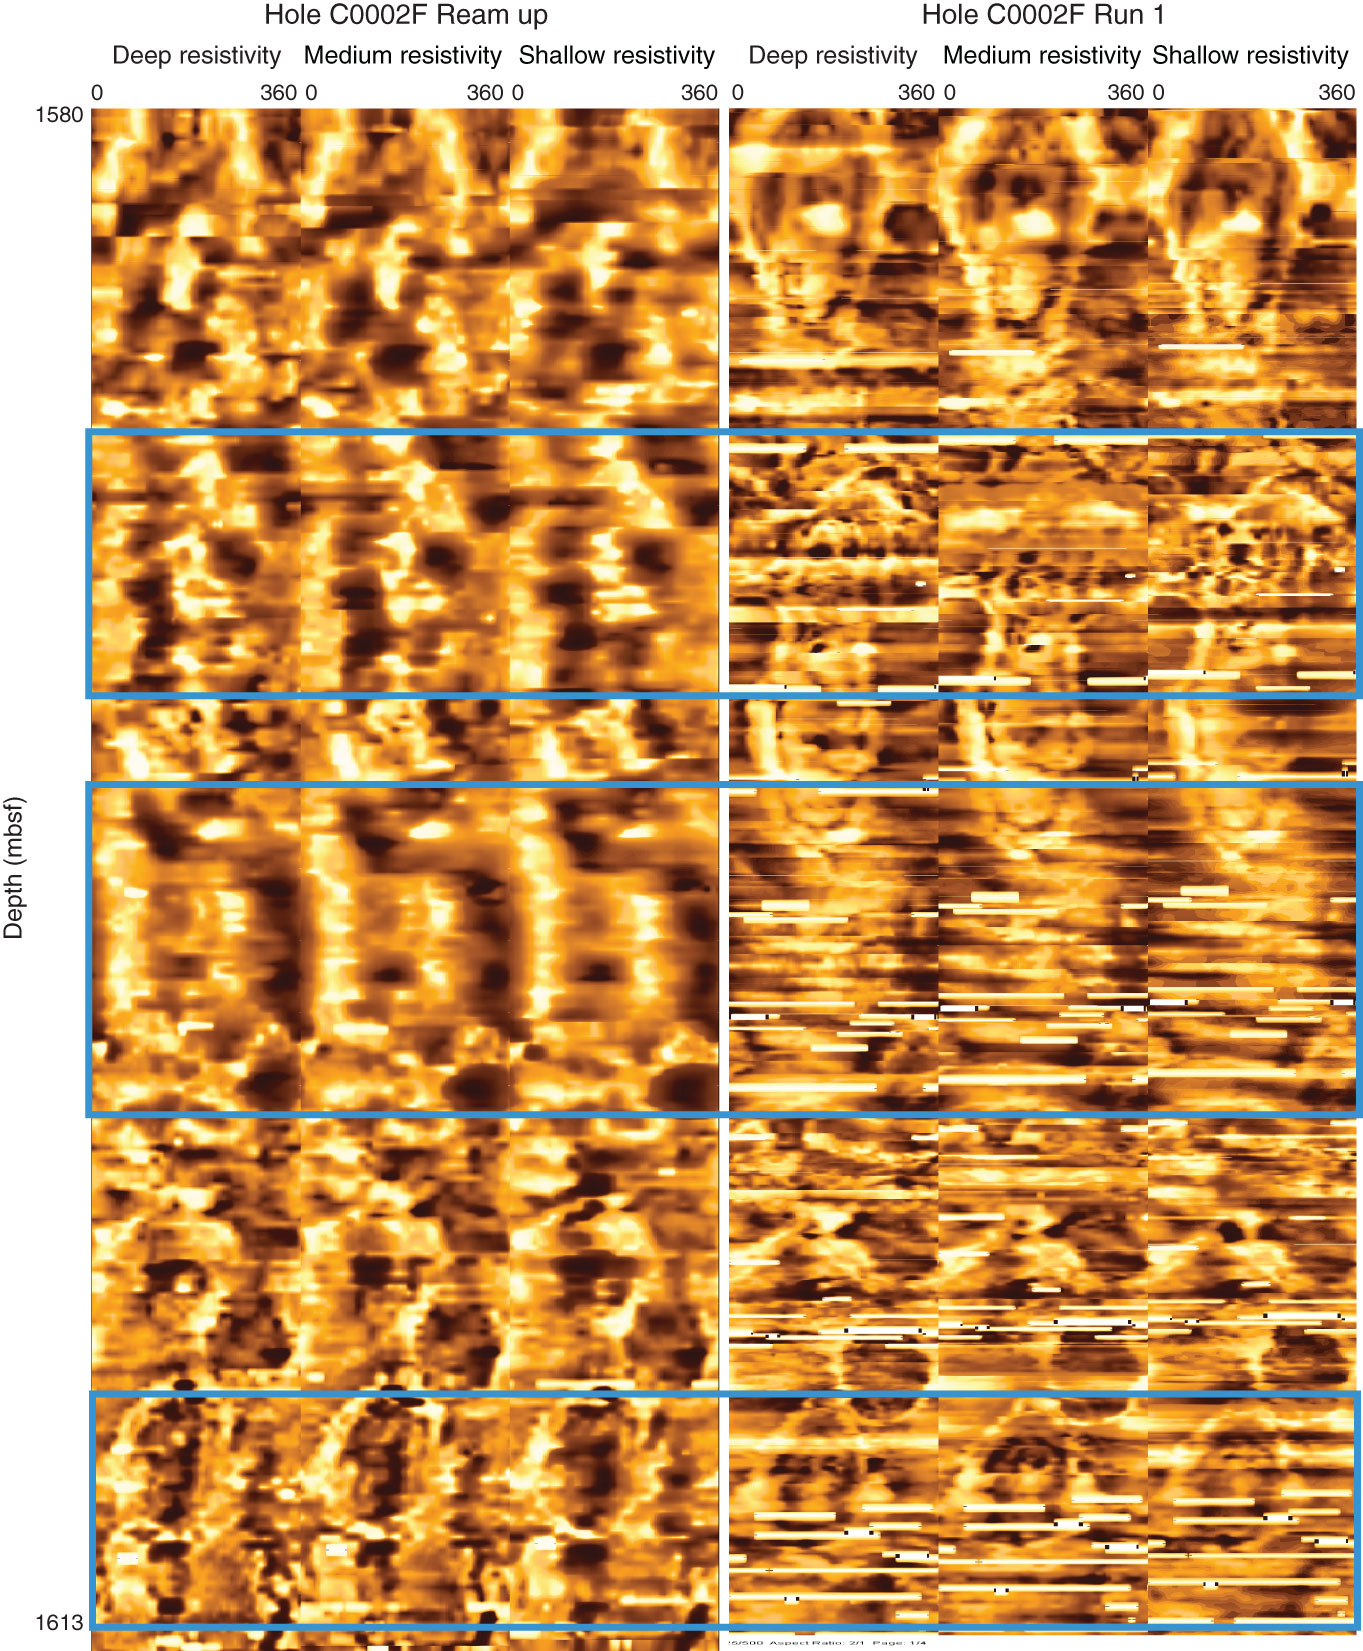
Figure F17. Comparison of resistivity images obtained from a relogged section (left) with the original data (right), Hole C0002F.
Previous | Close | Next | Top of page