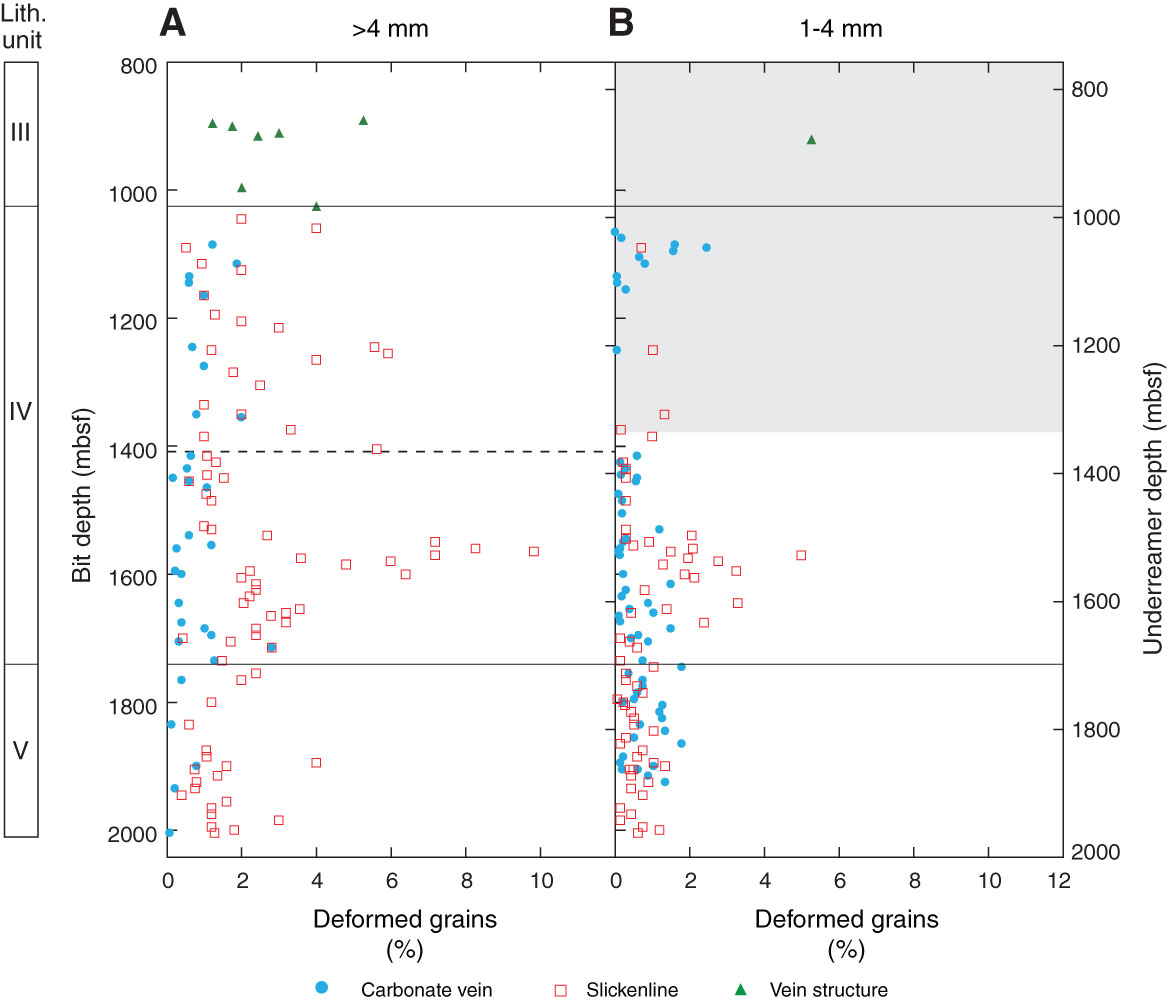
Figure F54. Depth distribution of documented deformation structures in cuttings samples, Hole C0002F. A. >4 mm size fraction. B. 1–4 mm size fraction. Abundance of grains with deformation structures at each depth is obtained by dividing the number of grains that show deformation structures by the number of investigated grains. Solid horizontal lines = lithologic unit boundaries. Note that the method of counting deformation structures in the >4 mm size fraction changed at 1415.5 mbsf (dashed line in A), and observations on 1–4 mm cuttings were routinely performed only for depths deeper than 1375.5 mbsf (interval with only spot counting; shaded area in B) (see “Structural geology” in the “Methods” chapter [Strasser et al., 2014a]).

Previous | Close | Next | Top of page