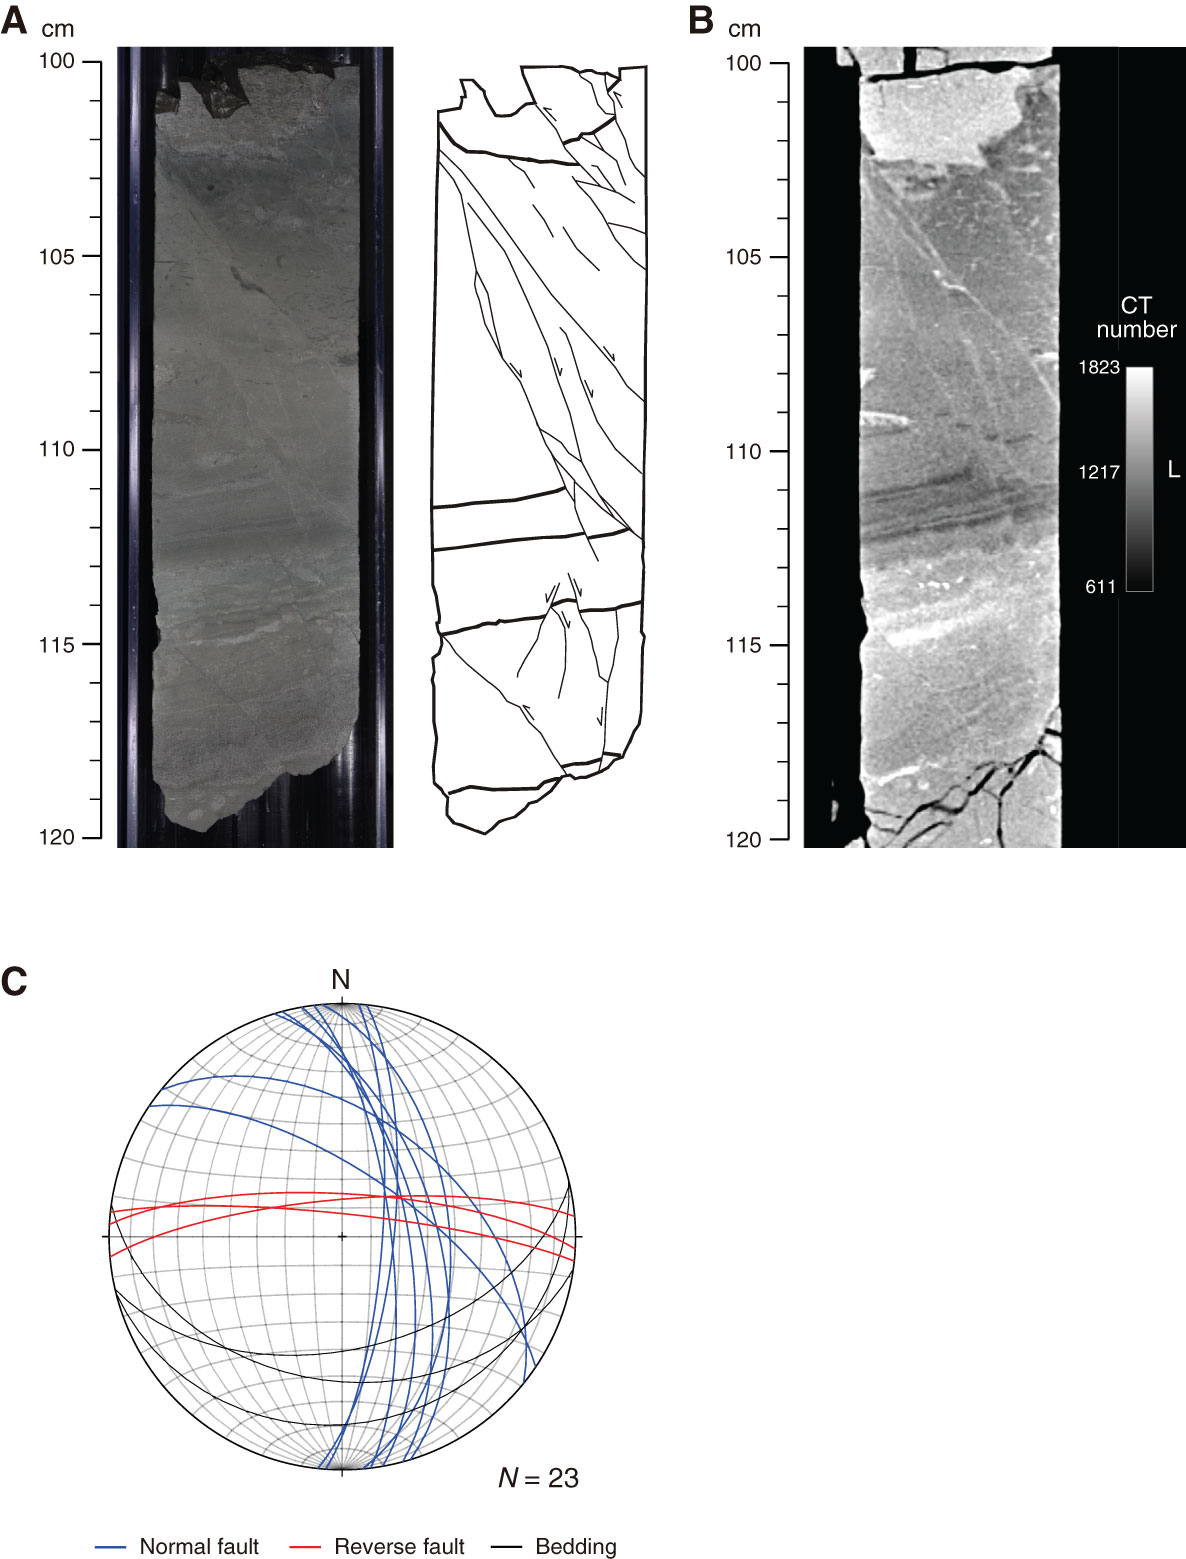
Figure F69. Normal fault zone (interval 338-C0002H-1R-1, 99–120 cm). A. Photograph of the working-half split surface and corresponding sketch. B. X-ray computed tomography (CT) image corresponding to A. C. Lower-hemisphere equal-area projections of bedding and fault planes obtained from CT images of the same interval (reoriented into true geographic coordinates).
Previous | Close | Next | Top of page