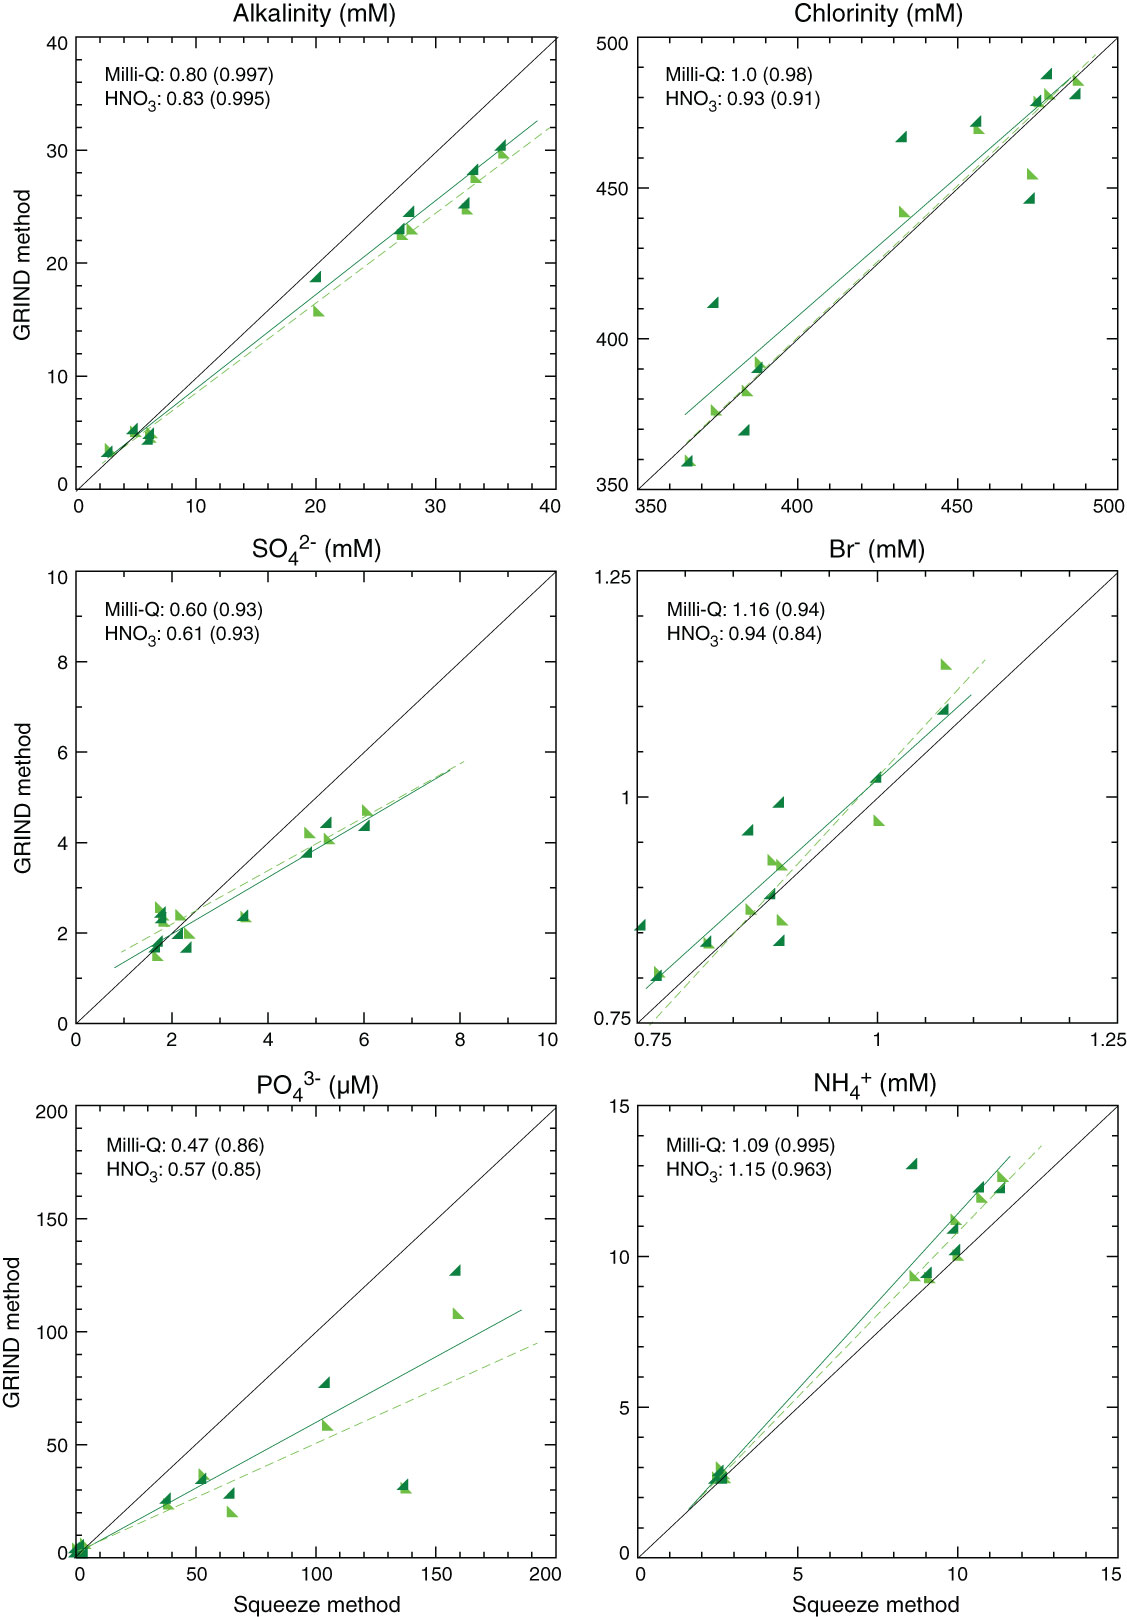
Figure F72. Concentrations obtained using the standard squeezing method plotted against those obtained using the ground rock interstitial normative determination (GRIND) method, Holes C0002H and C0002J. Milli-Q and HNO3 numbers give the slope of least-square fitted lines and correlation coefficients (R) in parentheses. Light green triangles = data from Milli-Q water extracted solution, dark green triangles = data from diluted HNO3 extracted solution, black line = 1:1 ratio of the concentrations, green lines = least-square fitted lines, corresponding to each colored data. (Continued on next four pages.)
Previous | Close | Next | Top of page