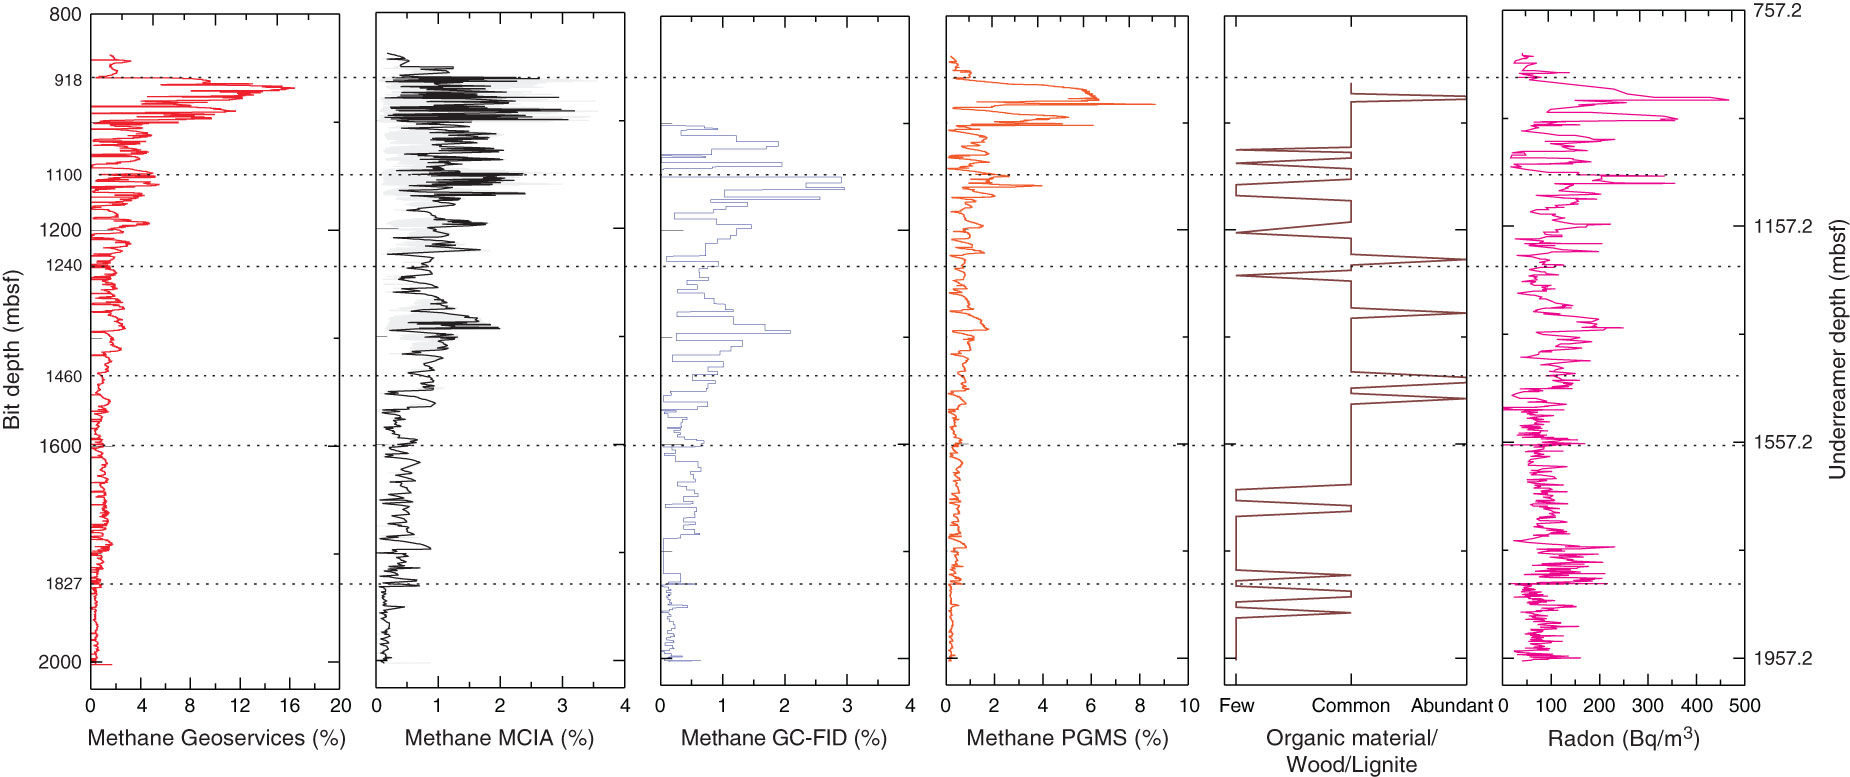
Figure F75. Methane concentrations determined by different measurement techniques, estimates of organic matter from cuttings (see “Lithology”), and Rn data, Hole C0002F. For methane carbon isotope analyzer (MCIA), an envelope was plotted (black); shaded region = original data. The different gas data sets show an overall good correlation in trends. Six different hydrocarbon gas boundaries were defined. GC-FID = gas chromatograph–flame ionization detector, PGMS = process gas mass spectrometer.
Previous | Close | Next | Top of page