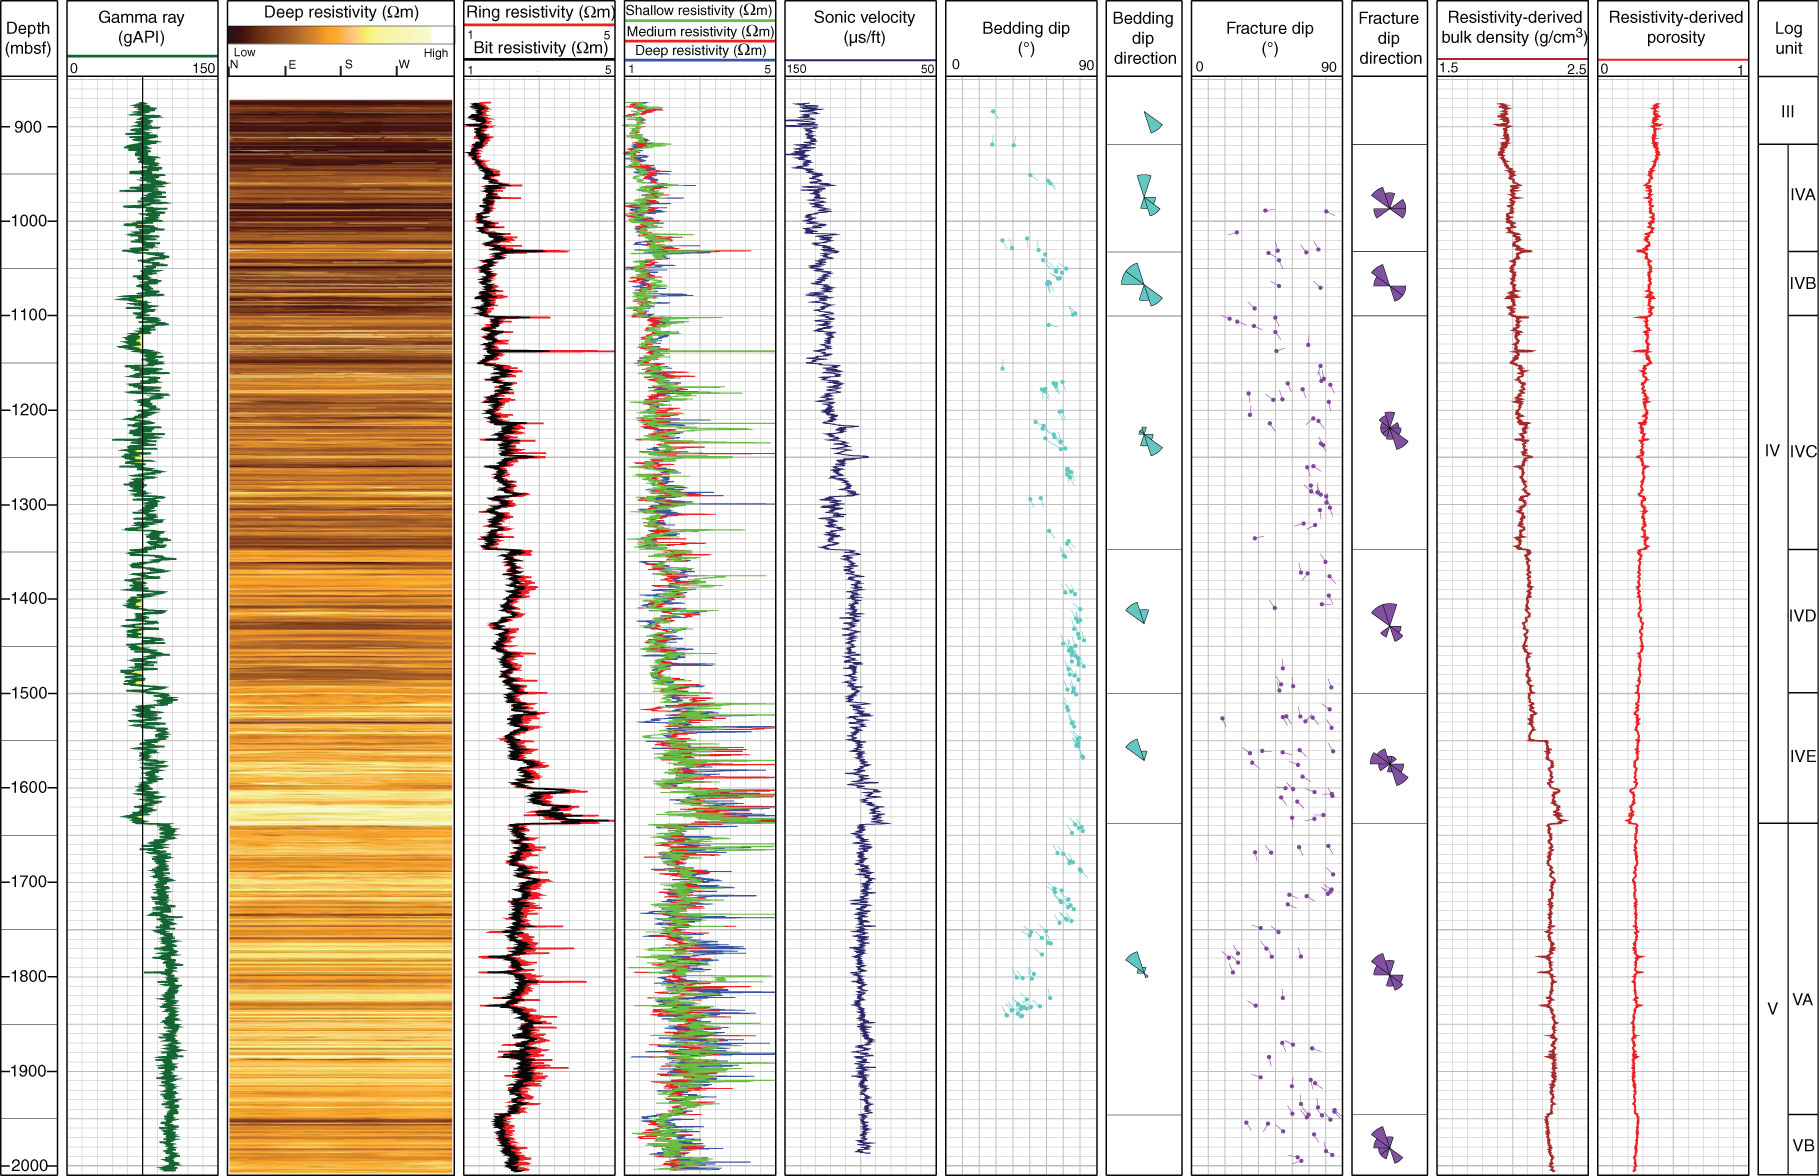
Figure F8. Composite plot of LWD data for Hole C0002F showing gamma ray, deep button resistivity image, resistivity logs, sonic slowness (velocity), fracture and bedding orientation, resistivity-derived bulk density and porosity, and logging units.
Previous | Close | Next | Top of page