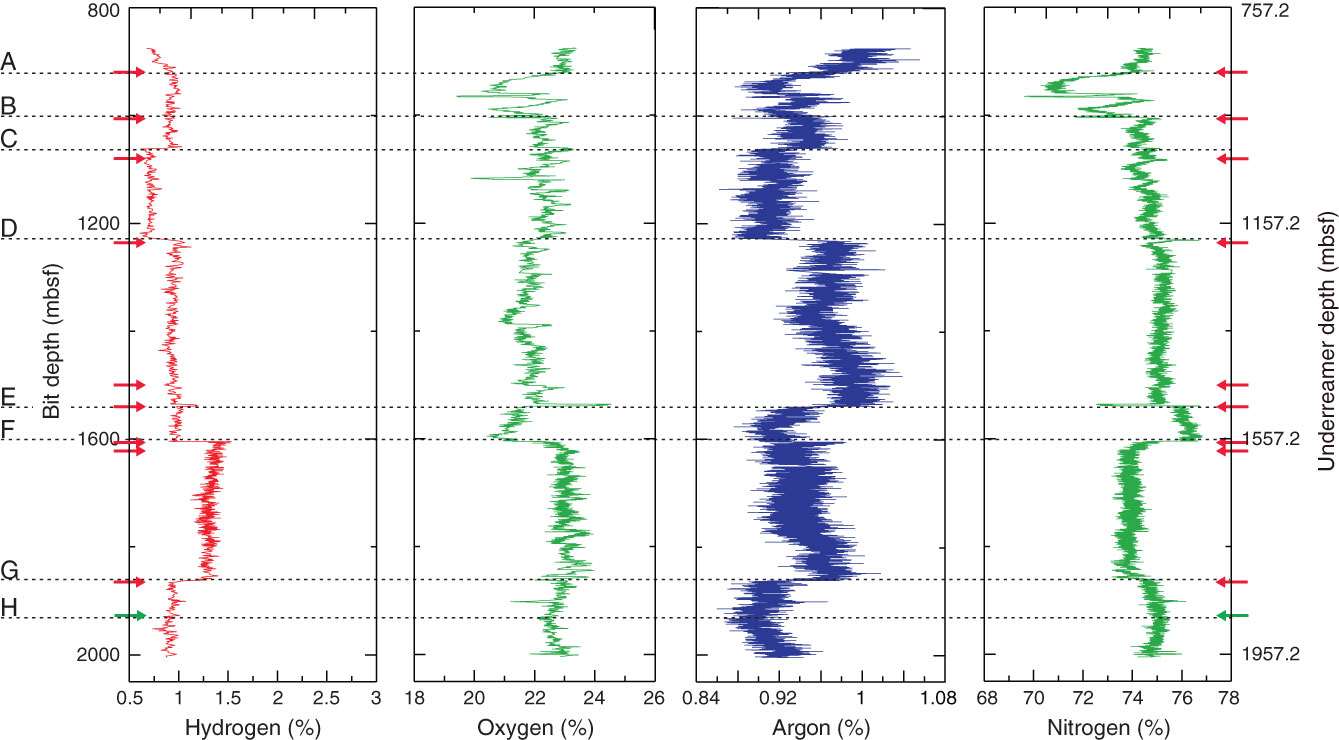
Figure F80. Plot of PGMS, Rn, and CO2 data provided by Geoservices, Hole C0002F. The data are characterized by several different shifts and/or peaks, some of which are correlatable across all gas species. Red arrows = depths where downtimes exceeded 120 min, green arrow = downtime of 39.5 min. Nonhydrocarbon boundary depths: A = 918 mbsf, B = 1000 mbsf, C = 1060 mbsf, D = 1240 mbsf, E = 1540 mbsf, F = 1600 mbsf, G = 1855 mbsf, and H = 1933 mbsf. (Continued on next page.)
Previous | Close | Next | Top of page