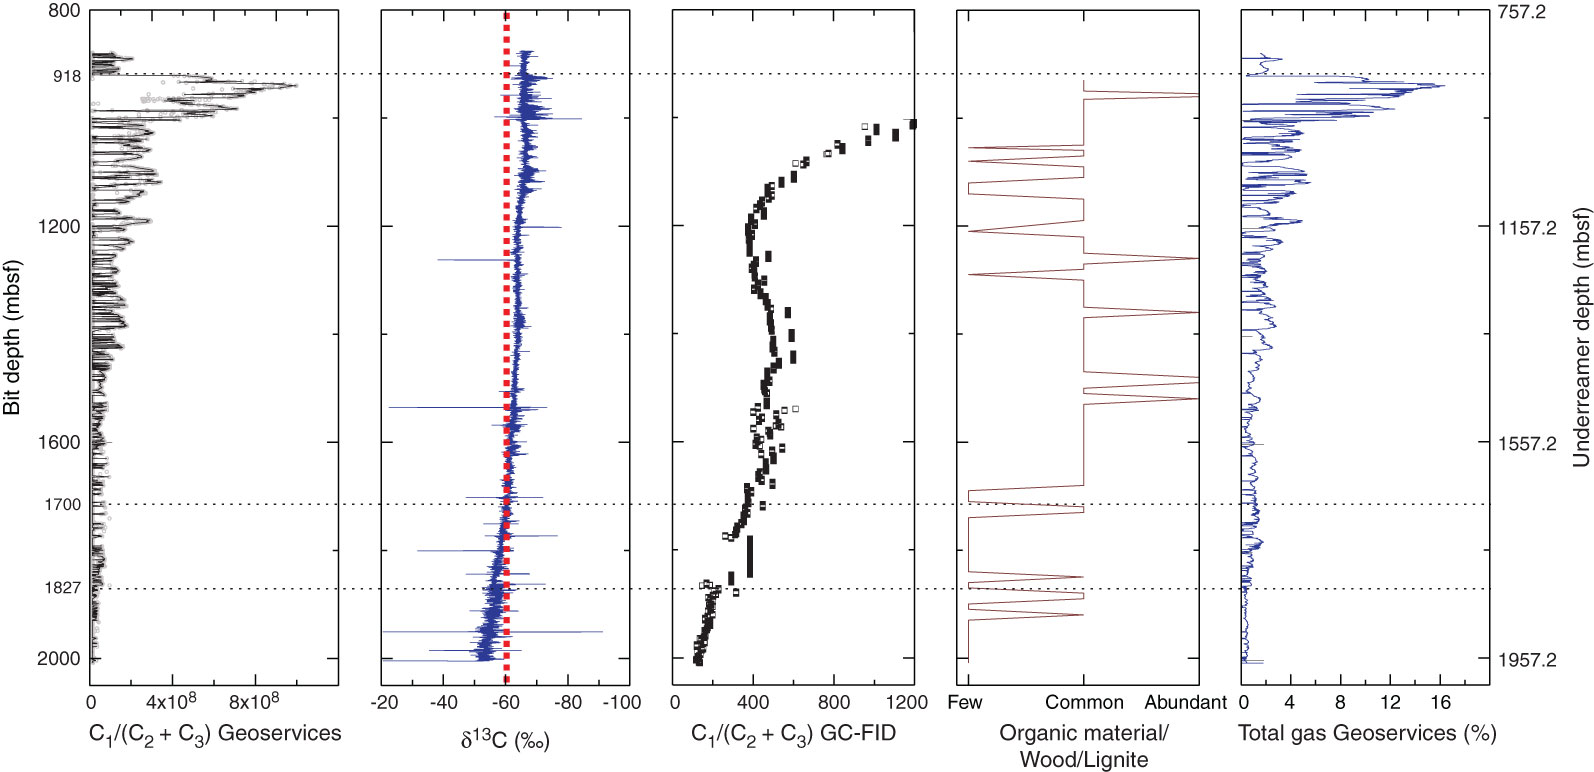
Figure F81. Total gas and Bernard parameters based on hydrocarbon gas data provided by Geoservices and determined by gas chromatograph–flame ionization detector (GC-FID), Hole C0002F. δ13C values were measured by the MCIA and relative abundance of organic material is given as estimated from cuttings (see “Lithology”). For better visualization, only Bernard parameters based on significant amounts of ethane and/or propane (i.e., >0.0001%) were plotted. Red dotted line in δ13C plot = beginning of a thermogenic signature (> –60‰). The boundary at 918 mbsf as seen in the gas data and defined by LWD (left column) and lithology is also visible in Bernard parameters and organic material. At ~1700 mbsf, a gradual shift to thermogenic signatures such that (C1/(C2 + C3) decreases and δ13C becomes > –60‰ is visible. Between 1800 and 1827 mbsf, a step in the Bernard parameter occurs, whose lower boundary correlates well with a drop in total gas concentration.
Previous | Close | Next | Top of page