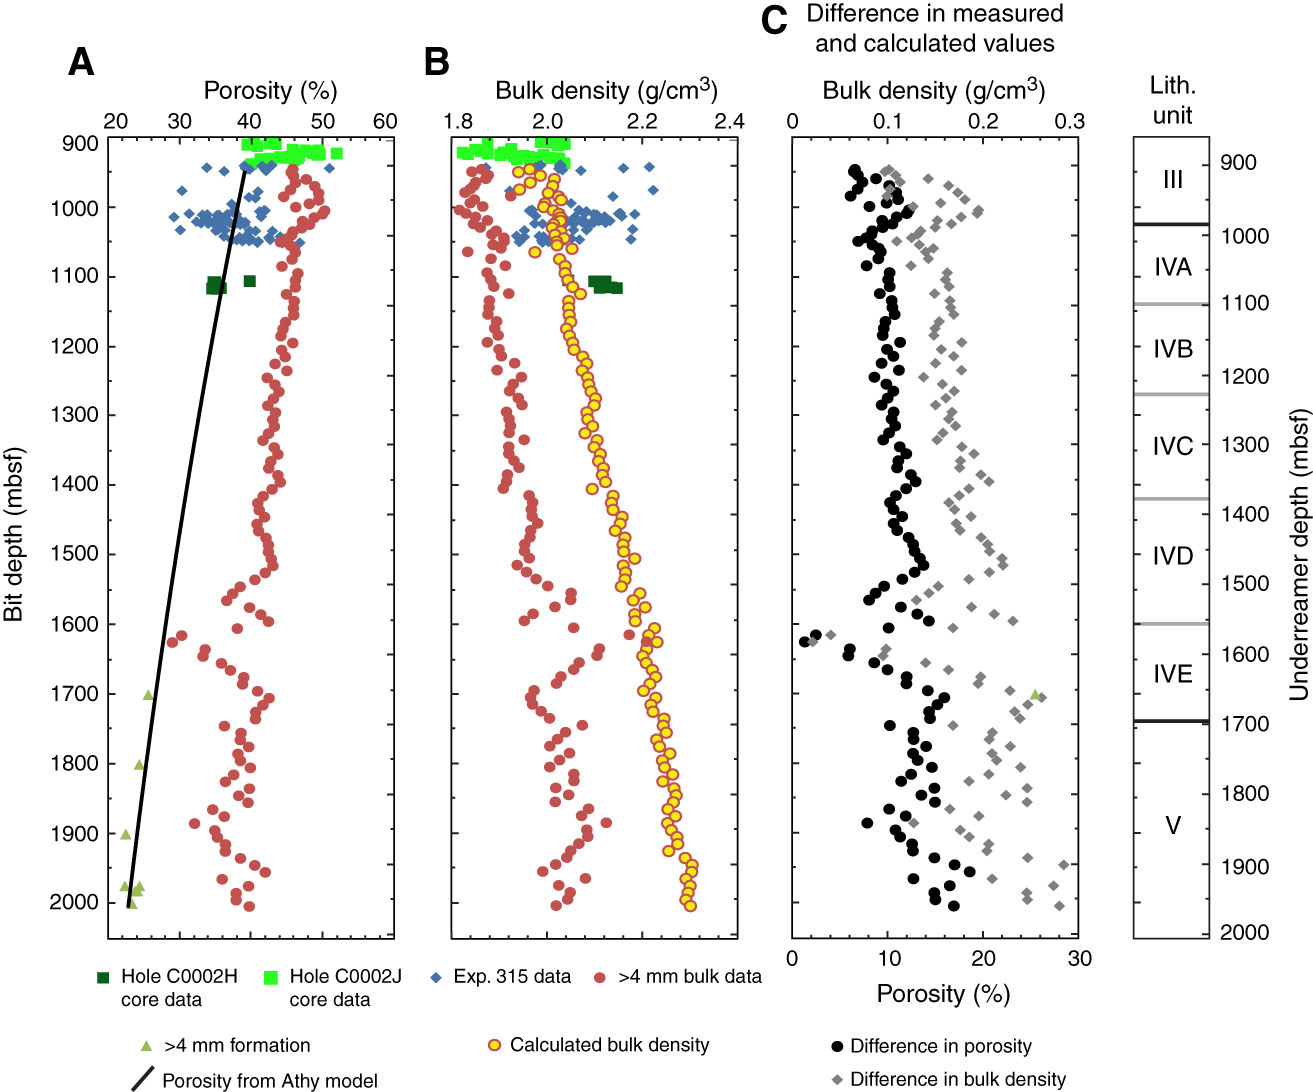
Figure F97. A. Compiled MAD porosity data from Hole C0002B (Expedition 315 Scientists, 2009b) and hand-picked samples of intact formation cuttings from Hole C0002F in comparison with porosity data of the >4 mm cuttings from Hole C0002F. Black line = best-fit Athy model to Expedition 315 and hand-picked data (see Equation 3). B. MAD bulk density data from >4 mm cuttings size fraction data in comparison with bulk density calculated from the Athy model porosity. C. Difference between MAD bulk data and data based on the Athy model. Underreamer depths are shown as a reference.
Previous | Close | Next | Top of page