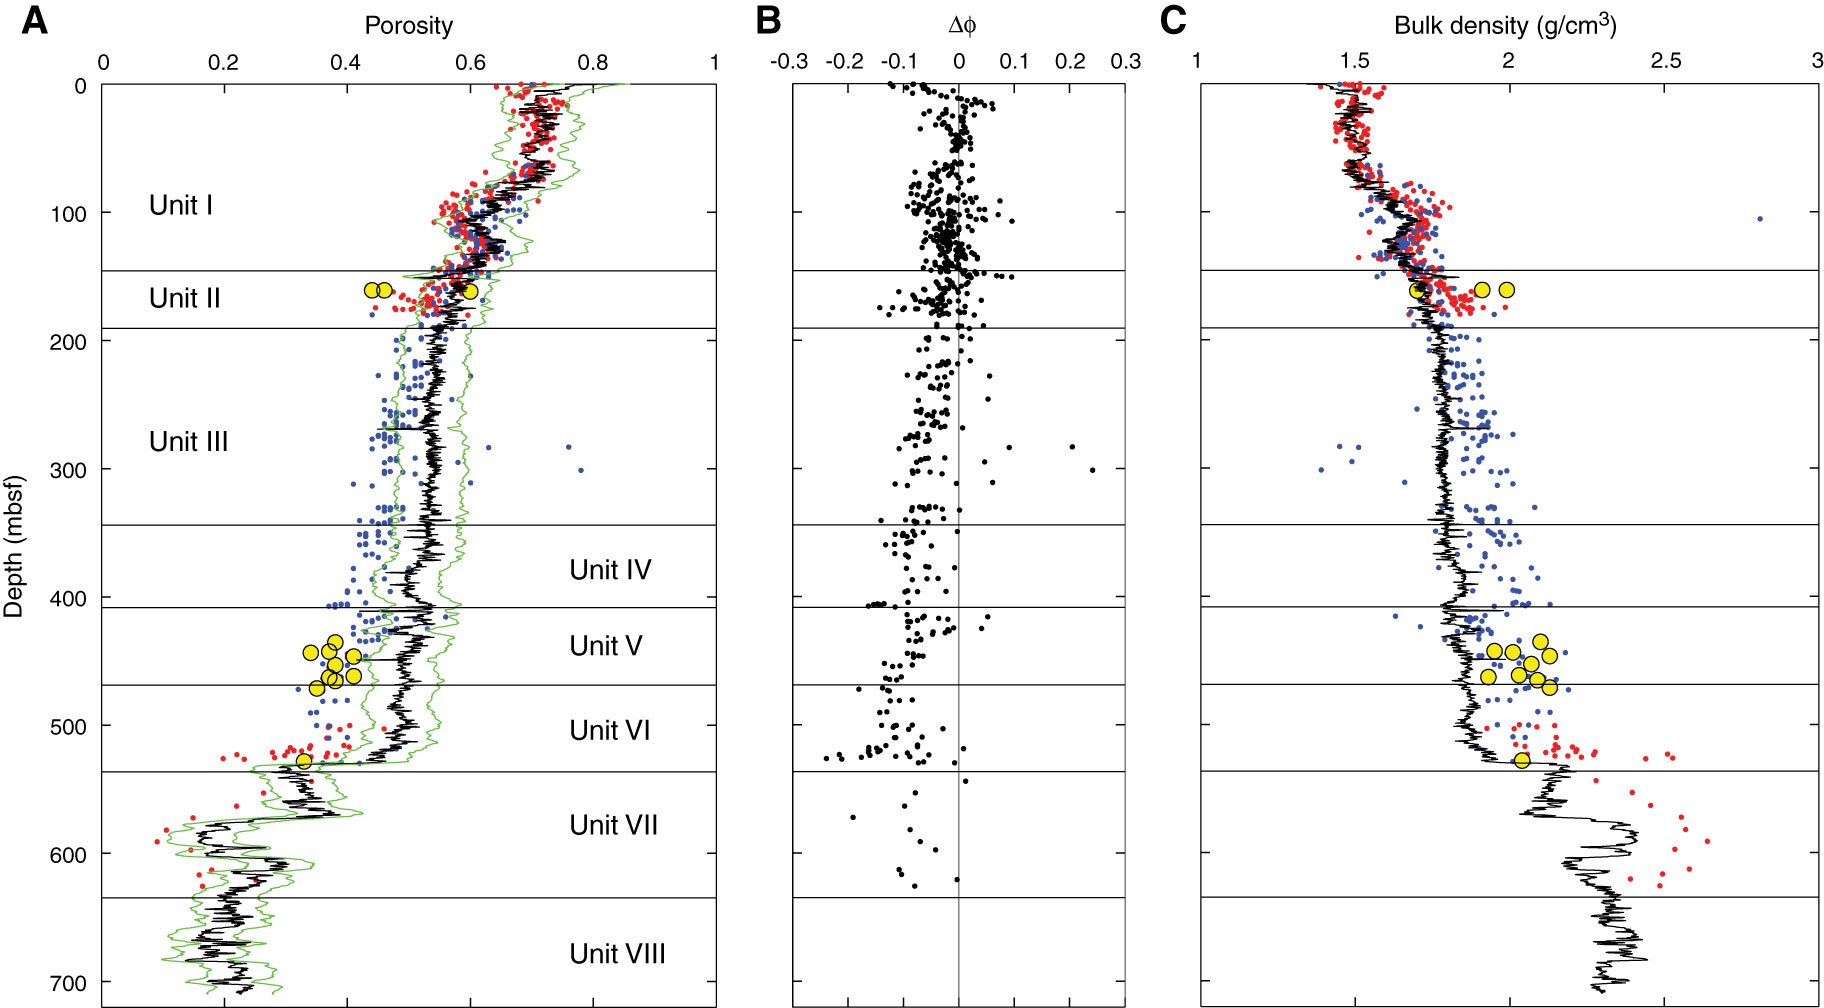
Figure F9. A. Resistivity-derived porosity (black line) plotted with moisture and density (MAD)-derived porosity from Expeditions 322 (blue = mudstone, yellow = sand) and 333 (red). Green lines show 1 standard deviation from the mean value of the resistivity-derived porosity trend. B. Offset Δϕ = ϕMAD – ϕresistivity between the MAD-derived and resistivity-derived porosity trends. C. Resistivity-derived bulk density from porosity values in A.
Previous | Close | Next | Top of page