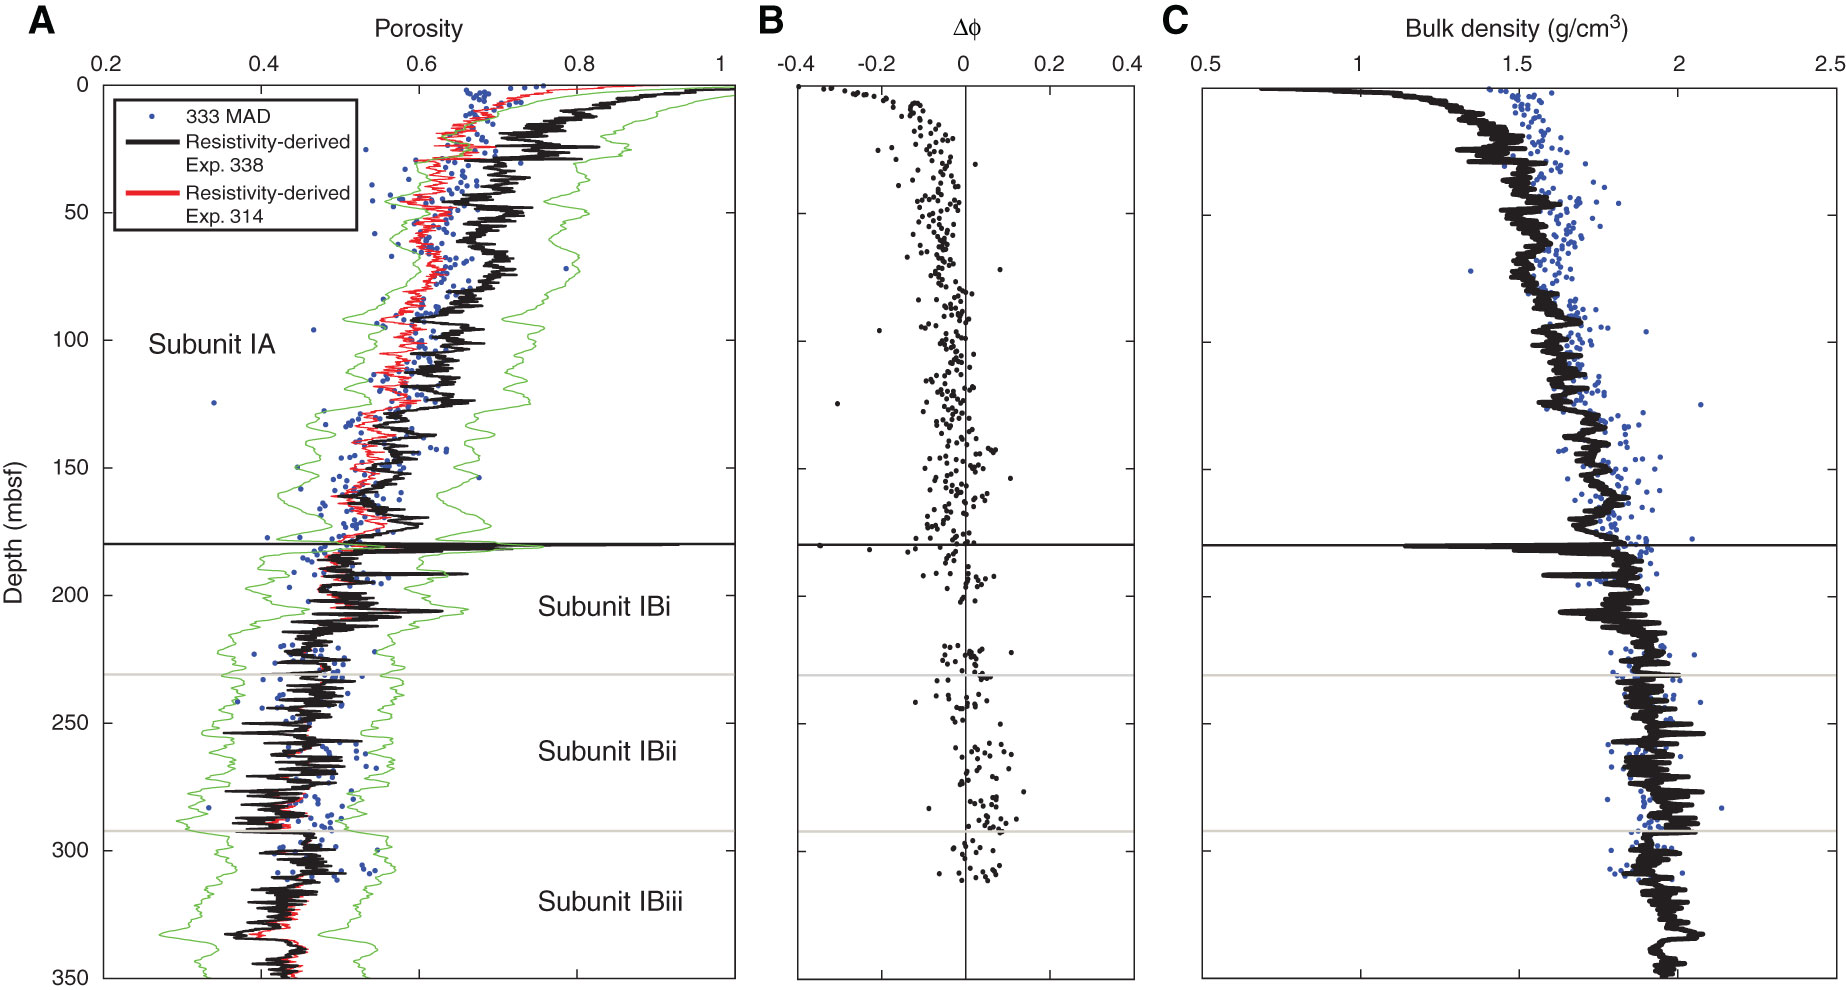
Figure F11. A. Resistivity-derived porosity plotted with moisture and density (MAD) porosity values from Expedition 333 (blue dots). Black line = resistivity-derived porosity using Archie parameters estimated from Expedition 333 Hole C0018A cores, red line = resistivity-derived porosity using Archie parameters estimated from Expedition 314 Hole C0002A LWD data, green lines = a 1 standard deviation margin from the mean value of the resistivity-derived porosity trend using Hole C0018A Archie parameters. B. Offset Δϕ = ϕMAD – ϕresistivity between the MAD-derived and resistivity-derived porosity data calculated using Archie parameters estimated for Site C0018. C. Resistivity-derived bulk density from porosity values shown by black line in A.
Previous | Close | Next | Top of page