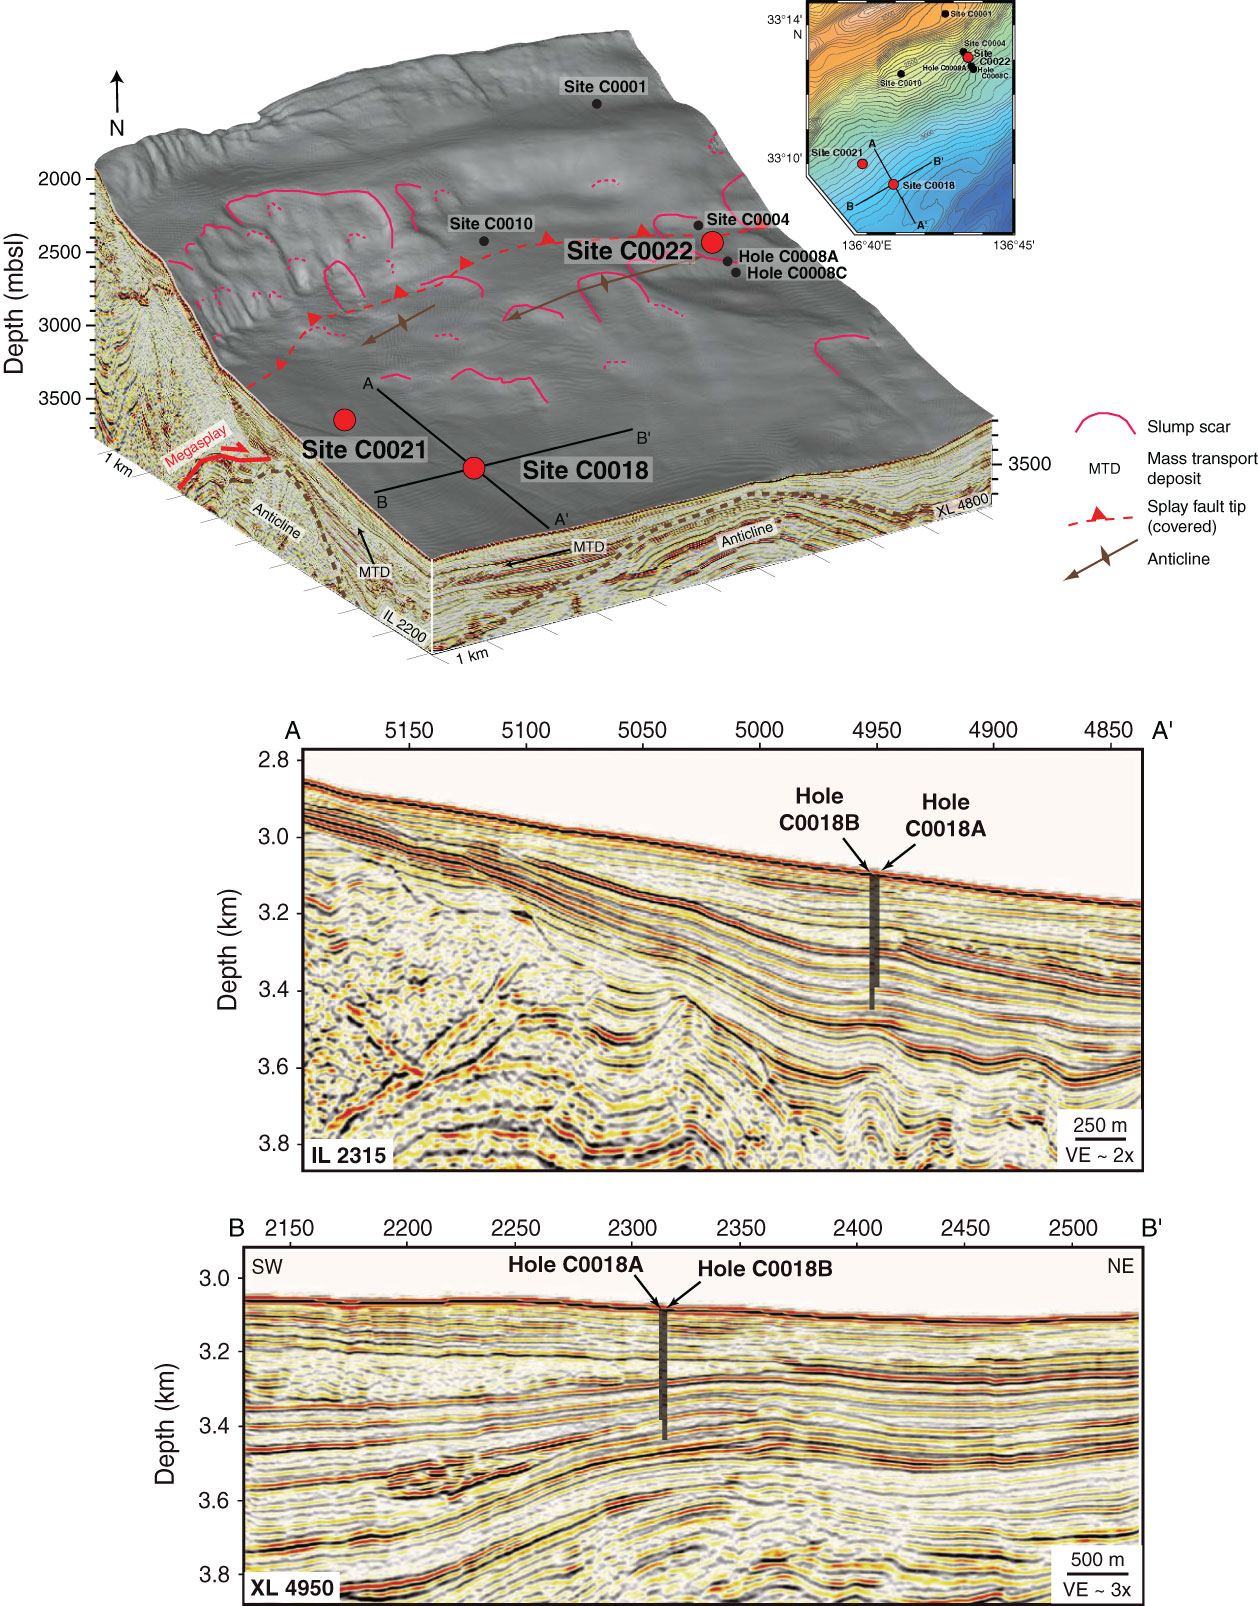
Figure F2. Block diagram with detailed bathymetry and interpreted structure around Site C0018 at the footwall of the splay fault together with adjacent drill sites (Strasser et al., 2011). Multichannel seismic in-line (IL) and cross-line (XL) over Site C0018. VE = vertical exaggeration.
Previous | Close | Next | Top of page