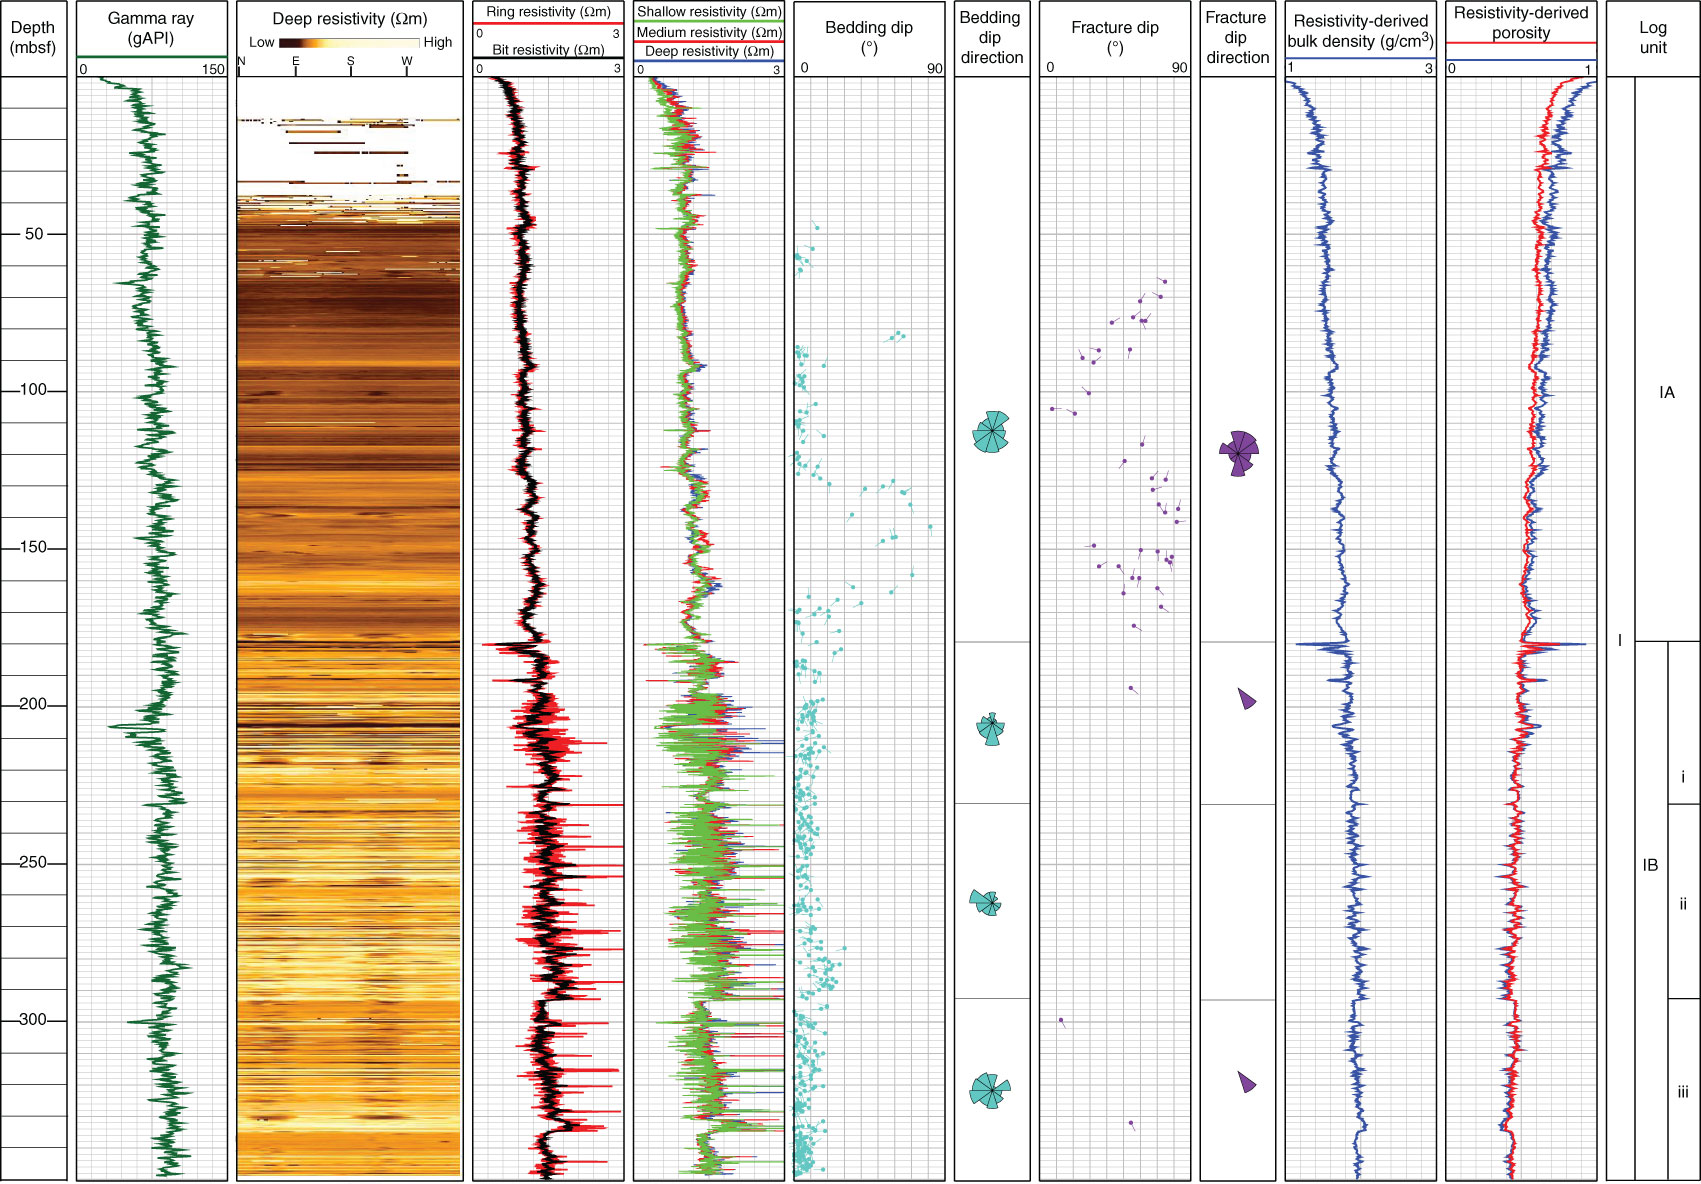
Figure F4. Overview composite plot of LWD data and deep resistivity image for Hole C0018B, with logging units, resistivity-derived porosity based on Archie parameters from Expedition 314 Hole C0002A LWD (red) and Expedition 333 Hole C0018A cores (blue), resistivity-derived bulk density, and bedding and fracture dips.
Previous | Close | Next | Top of page