Previous | Close | Next
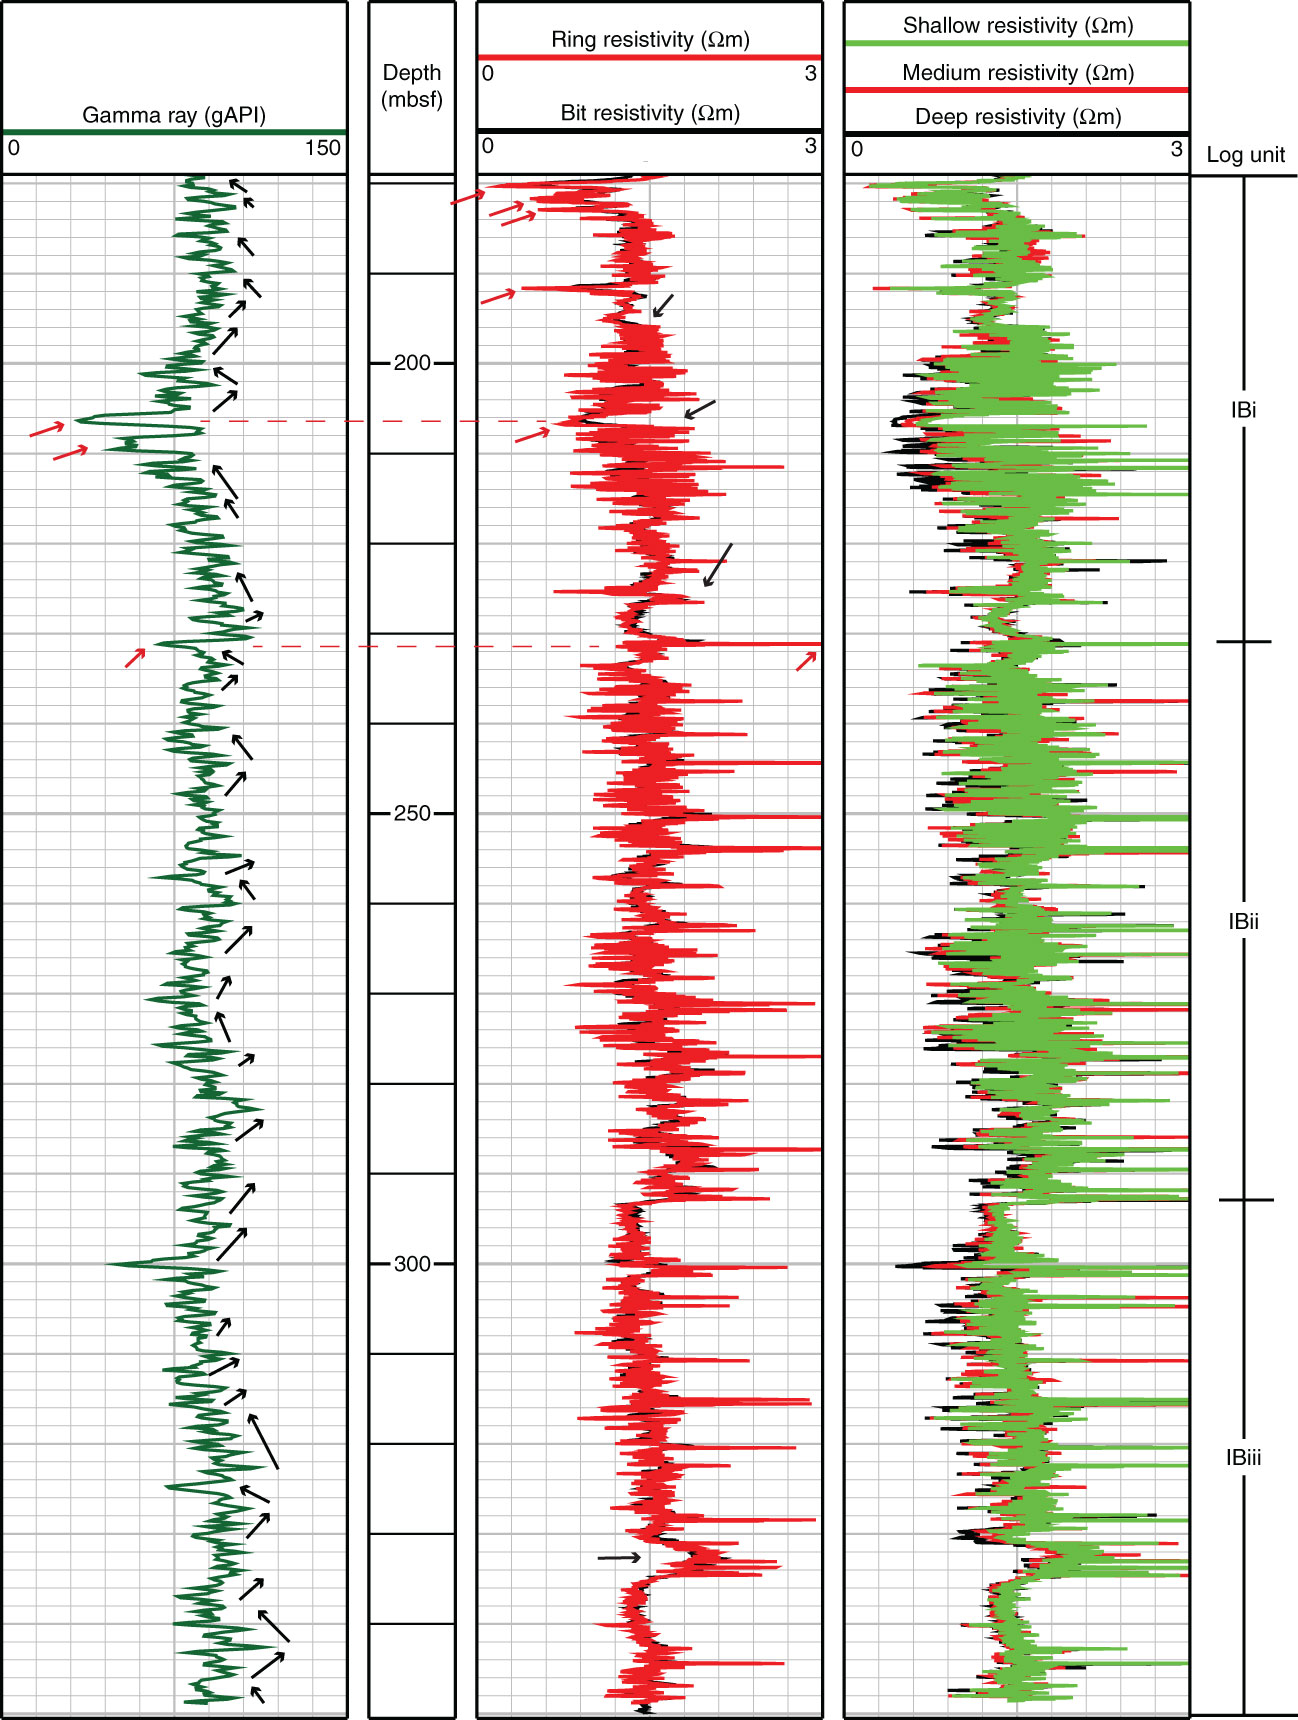
Figure F6. Composite plot of gamma ray and resistivity logs through logging Subunit IB in Hole C0018B, with observed trends (black arrows) and spikes (red arrows) highlighted.
Previous | Close | Next | Top of page