Previous | Close | Next
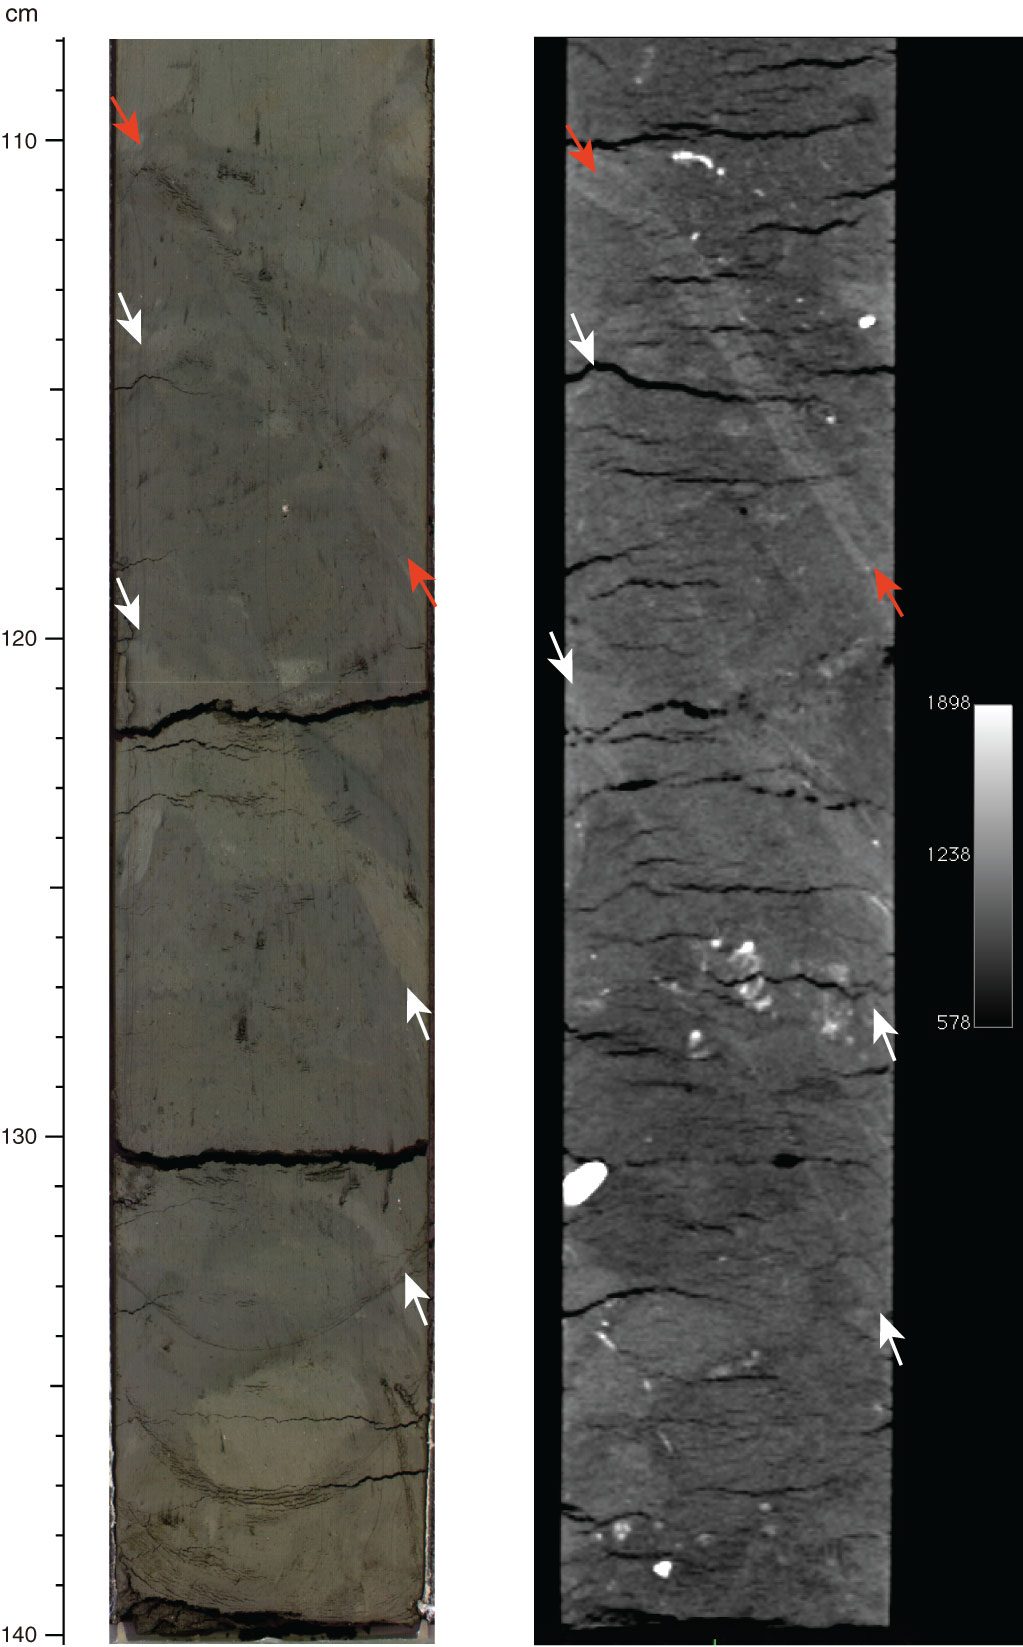
Figure F19. Example of shear zone (red arrows) and fault (white arrows) crossing MTD-related mud clasts shown on core split surface (left) and on X-ray CT image (right) (interval 338-C0021B-3H-6, 108–140 cm).
Previous | Close | Next | Top of page