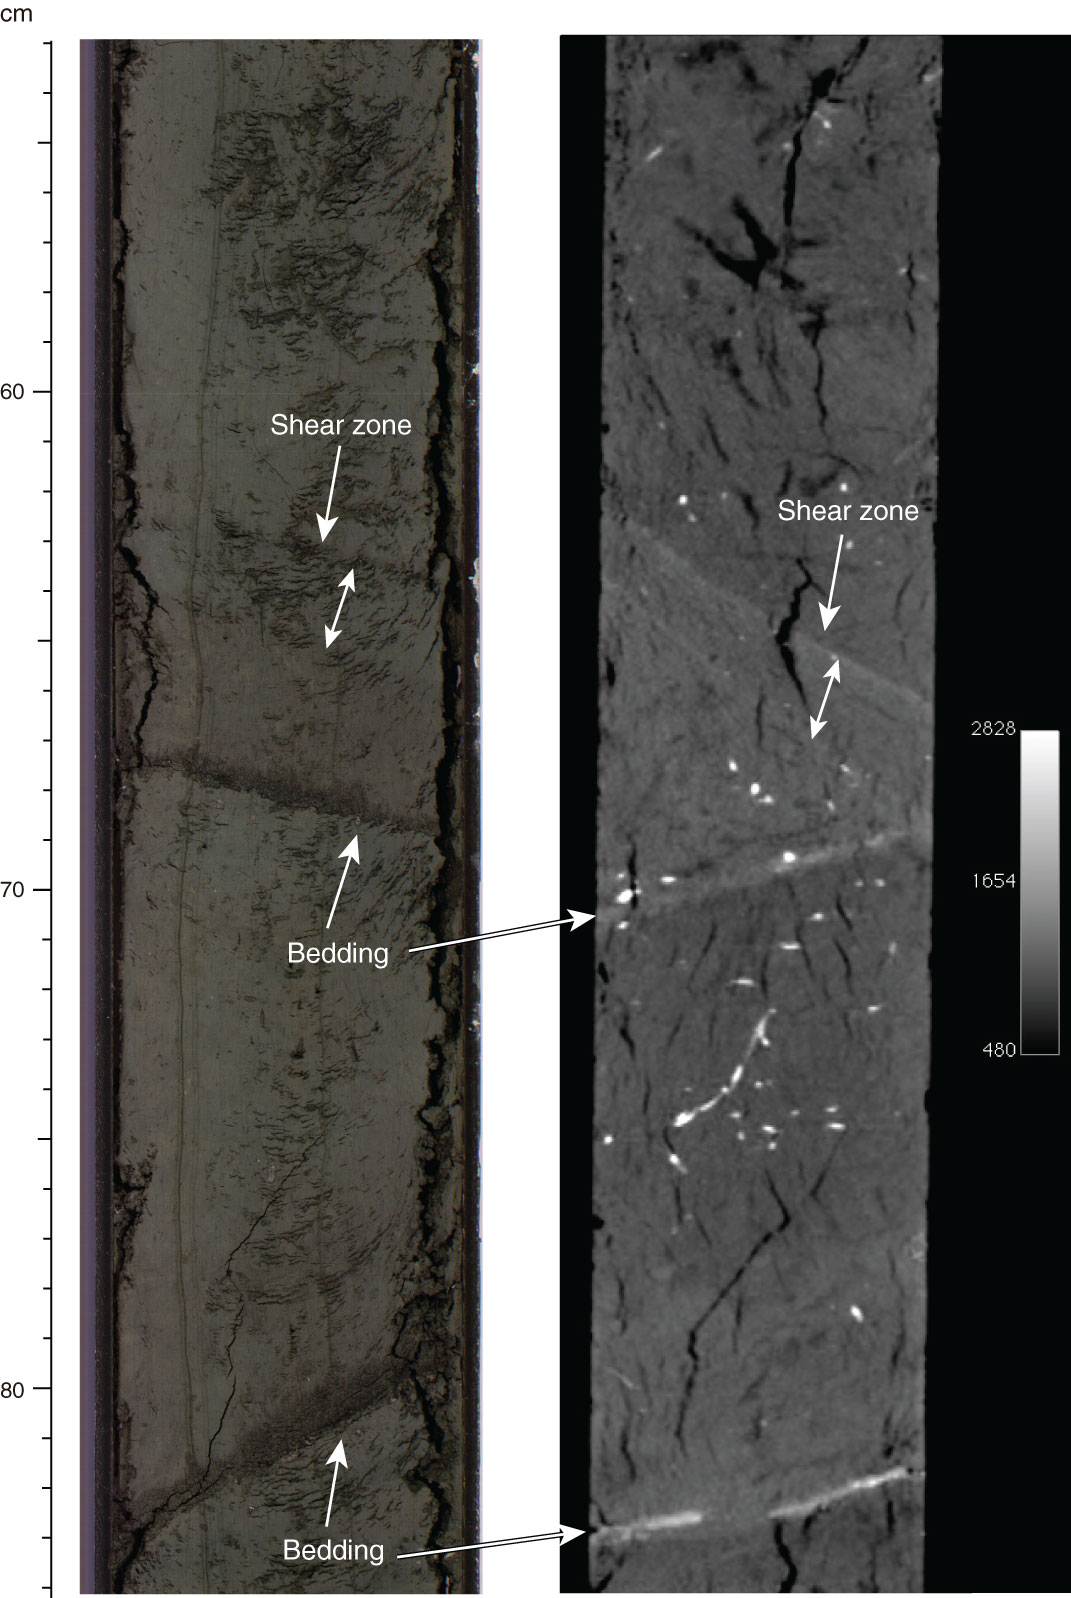
Figure F21. Shear zone truncating bedding (interval 338-C0021B-13T-1, 53–84 cm) shown on core split surface (left) and on X-ray CT image (right). This shear zone could represent the basal shear zone of MTD B. The X-ray CT image is oblique to the core split surface; hence the apparent differences, as seen in depth locations, thicknesses, and (apparent) dip angles of the structures between the two images.
Previous | Close | Next | Top of page