Previous | Close | Next
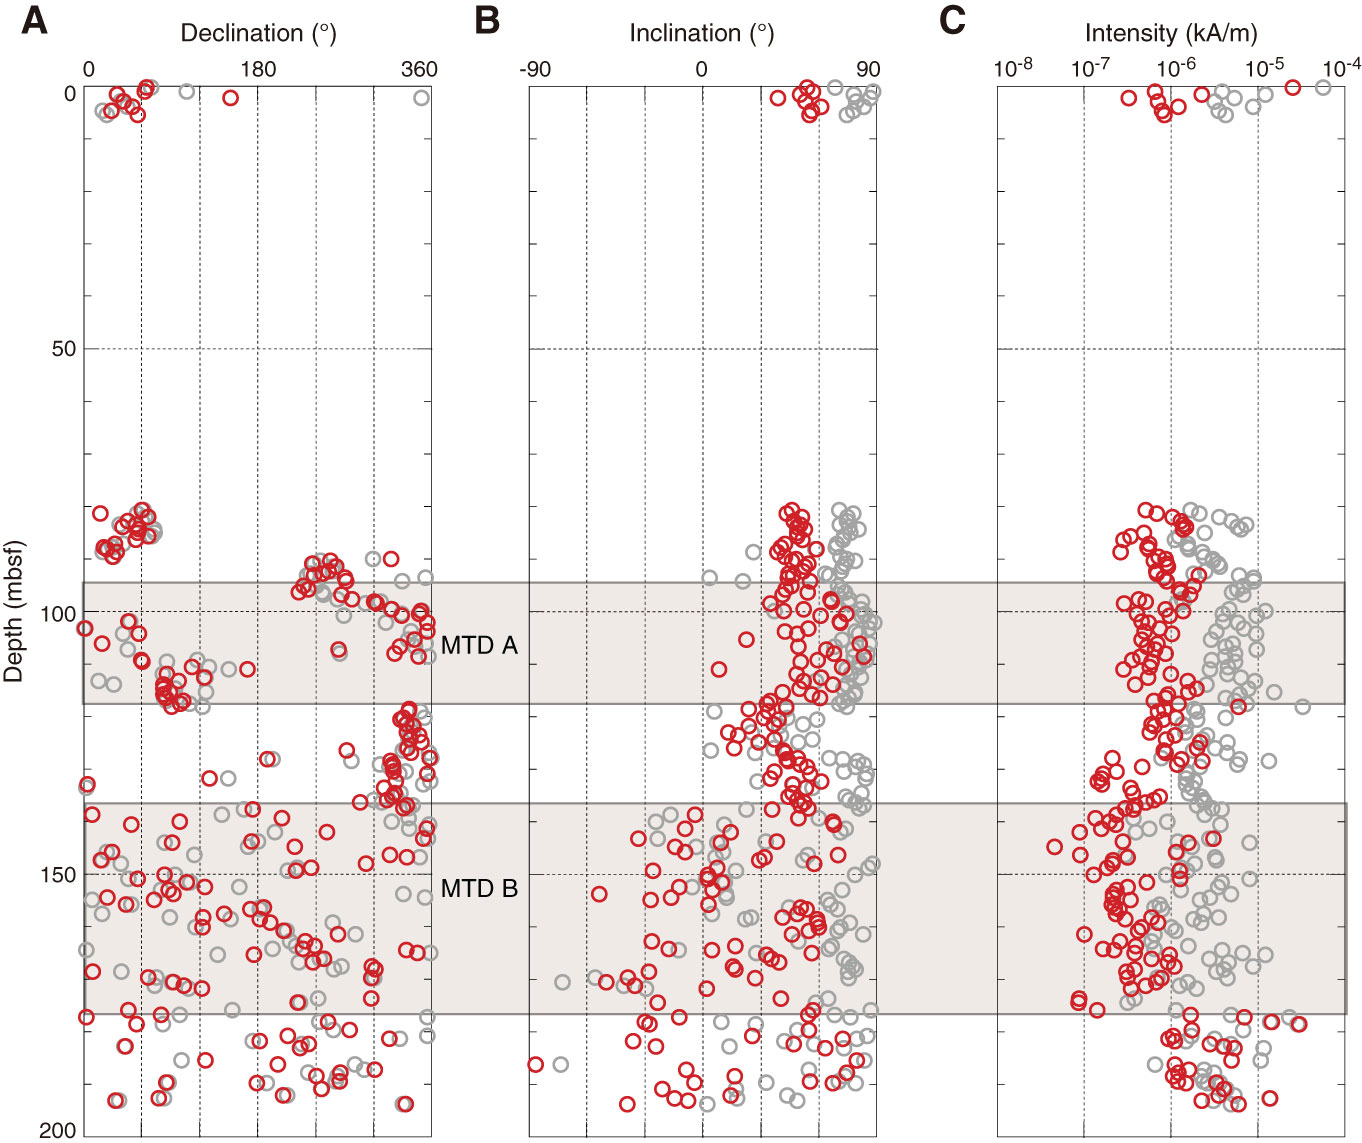
Figure F38. (A) Declination, (B) inclination, and (C) intensity, Hole C0021B. Gray = NRM, red = after 20 mT AF demagnetization. Shaded intervals identify locations of mass transport deposits (MTDs) A and B.
Previous | Close | Next | Top of page