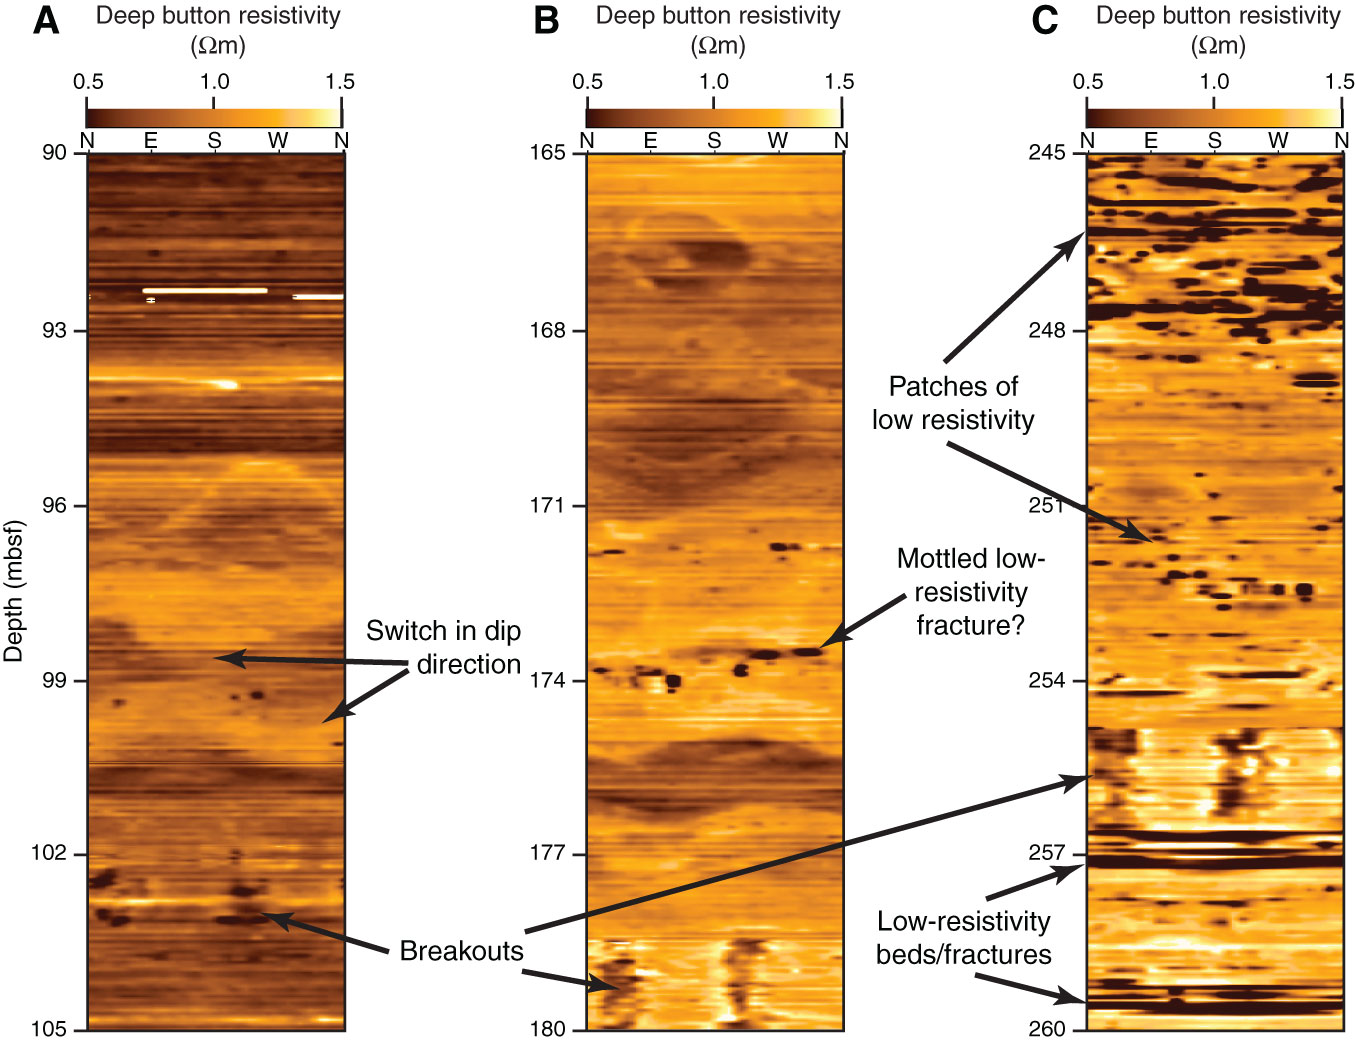
Figure F8. Prominent observations in the resistivity images of slope sediments in Hole C0021A. All images are plotted with a low-range resistivity scale (0.5–1.5 Ωm). A. Rapid change in dip direction observed in the upper interval of chaotic, high-angle bedding. B. Lower interval of high-angle bedding shows more gradational changes in dip direction, often separated by mottled, low-resistivity fractures. C. Patches of low resistivity are often observed in conjunction with low-resistivity beds or fractures.
Previous | Close | Next | Top of page