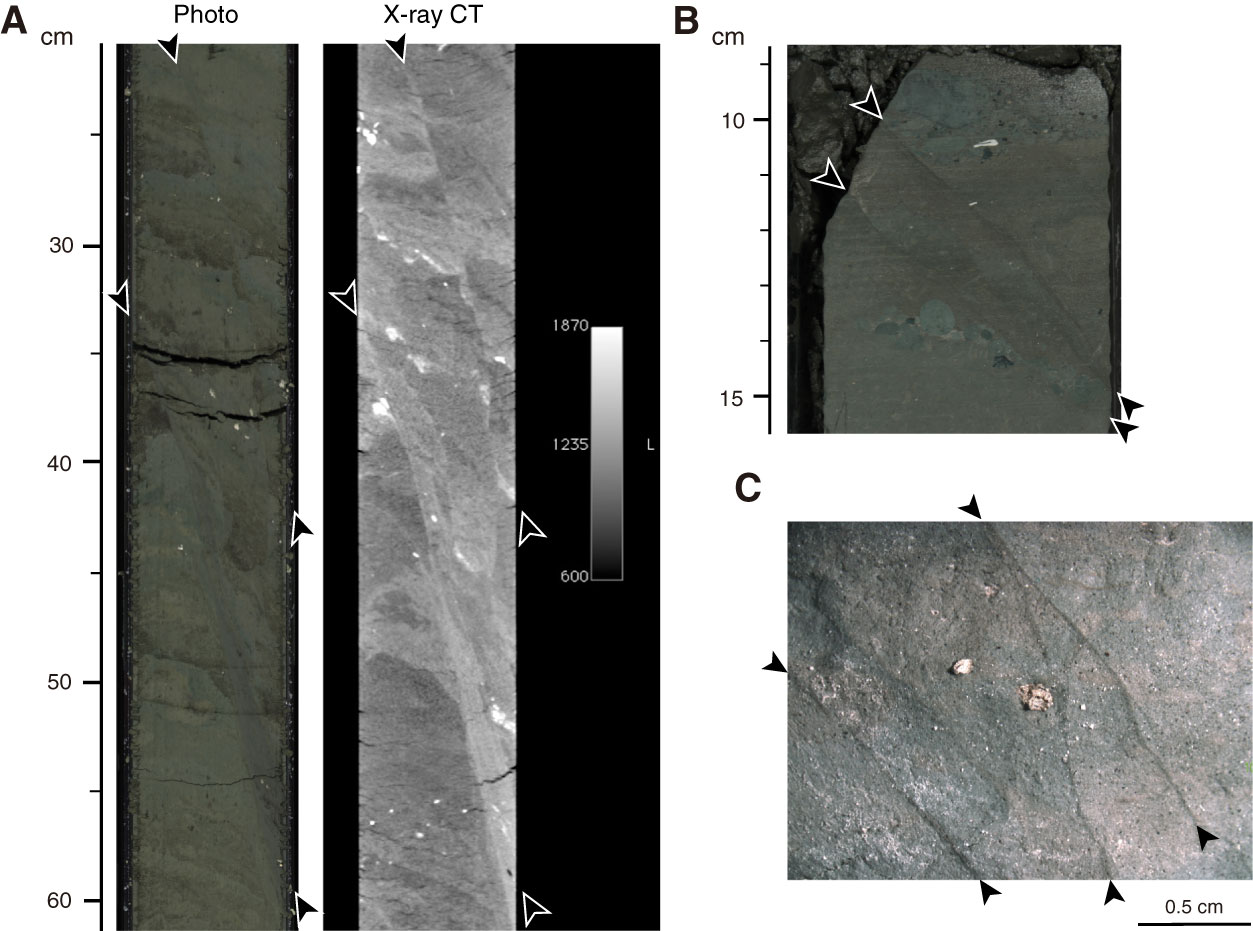
Figure F23. Examples of structures (arrows) observed on whole-round X-ray computed tomography (CT) scans and working halves of split cores. A. Photograph and X-ray CT scan image of split surface of normal faults showing smearing (interval 338-C0022B-8H-3, 20–60 cm). B. Deformation bands (interval 338-C0022B-38X-5, 9–15 cm). Offset horizontal beds indicate a normal component of displacement. C. Deformation bands (interval 338-C0022B-31X-8, 10–14 cm).
Previous | Close | Next | Top of page